What are the top 100 (most downloaded) R packages in 2013? Thanks to the recent release of RStudio of their “0-cloud” CRAN log files (but without including downloads from the primary CRAN mirror or any of the 88 other CRAN mirrors), we can now answer this question (at least for the months of Jan till May)!
By relying on the nice code that Felix Schonbrodt recently wrote for tracking packages downloads, I have updated my installr R package with functions that enables the user to easily download and visualize the popularity of R packages over time. In this post I will share some nice plots and quick insights that can be made from this great data. The code for this analysis is given at the end of this post.
Top 8 most downloaded R packages – downloads over time
Let’s first have a look at the number of downloads per day for these 5 months, of the top 8 most downloaded packages (click the image for a larger version):
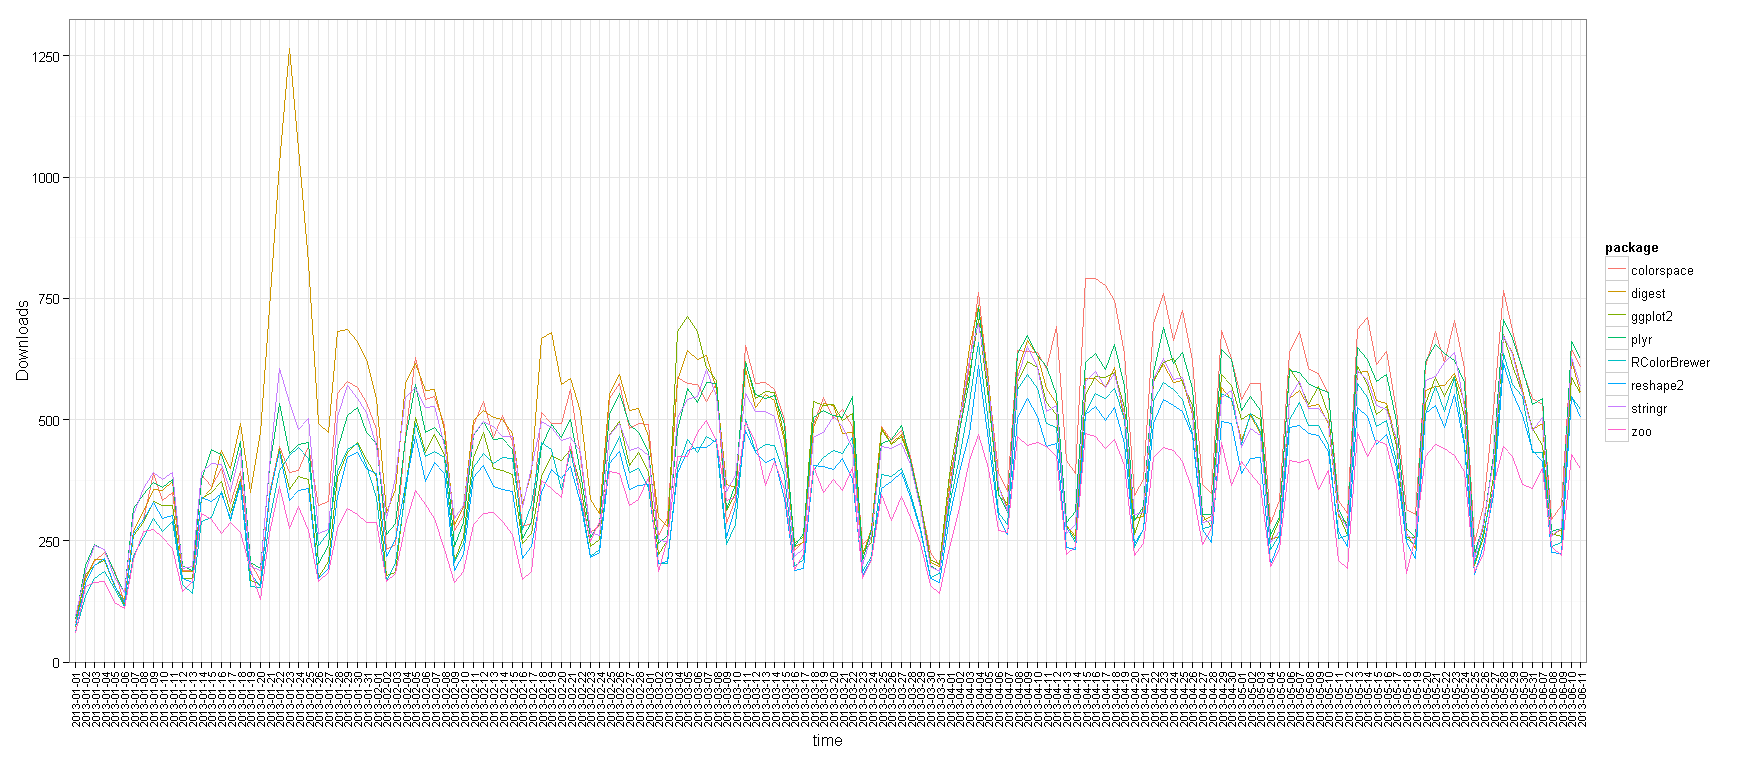
We can see the strong weekly seasonality of the downloads, with Saturday and Sunday having much fewer downloads than other days. This is not surprising since we know that the countries which uses R the most have these days as rest days (see James Cheshire’s world map of R users). It is also interesting to note how some packages had exceptional peaks on some dates. For example, I wonder what happened on January 23rd 2013 that the digest package suddenly got so many downloads, or that colorspace started getting more downloads from April 15th 2013.
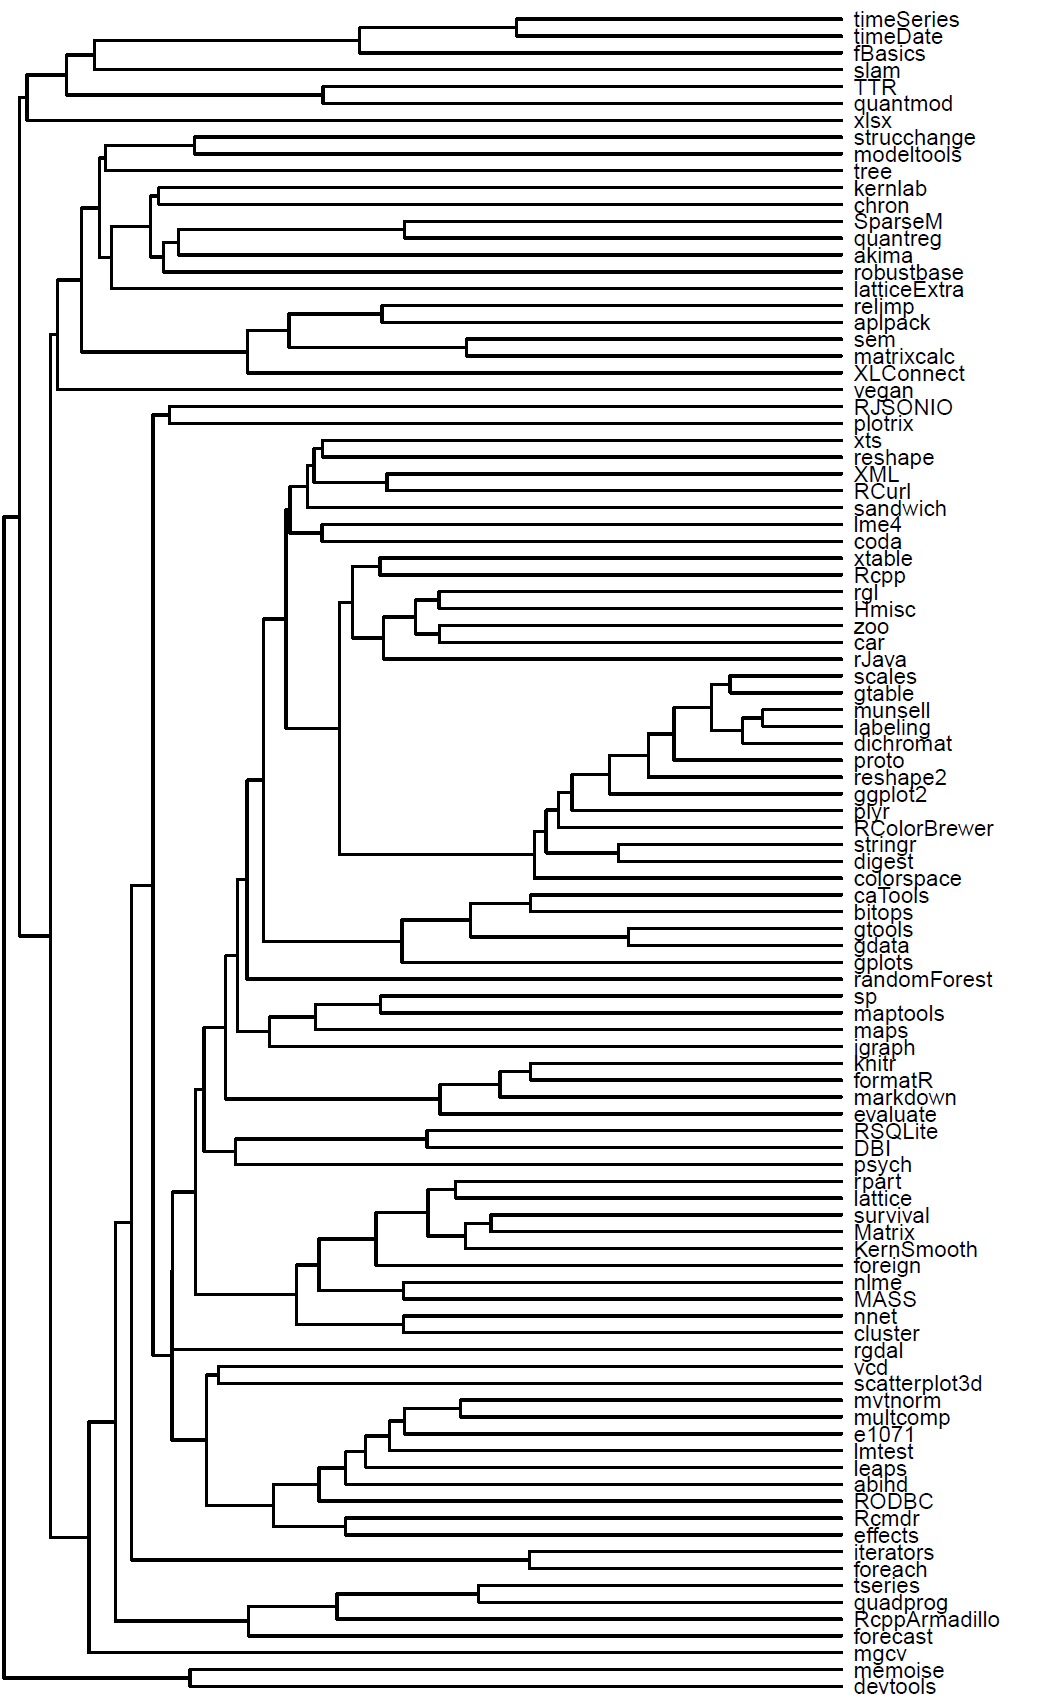
“Family tree” of the top 100 most downloaded R packages
We can extract from this data the top 100 most downloaded R packages. Moreover, we can create a matrix showing for each package which of our unique ids (censored IP addresses), has downloaded which package. Using this indicator matrix, we can thing of the “similarity” (or distance) between each two packages, and based on that we can create a hierarchical clustering of the packages – showing which packages “goes along” with one another.
With this analysis, you can locate package on the list which you often use, and then see which other packages are “related” to that package. If you don’t know that package – consider having a look at it – since other R users are clearly finding the two packages to be “of use”.
Such analysis can (and should!) be extended. For example, we can imagine creating a “suggest a package” feature based on this data, utilizing the package which you use, the OS that you use, and other parameters. But such coding is beyond the scope of this post.
Here is the “family tree” (dendrogram) of related packages:
To make it easier to navigate, here is a table with links to the top 100 R packages, and their links: