Visualization of regression coefficients (in R)

Update (07.07.10): The function in this post has a more mature version in the “arm” package. See at the end of this post for more details.
* * * *

Imagine you want to give a presentation or report of your latest findings running some sort of regression analysis. How would you do it?

This was exactly the question Wincent Rong-gui HUANG has recently asked on the R mailing list.

One person, Bernd Weiss, responded by linking to the chapter “Plotting Regression Coefficients” on an interesting online book (I have never heard of before) called “Using Graphs Instead of Tables” (I should add this link to the free statistics e-books list…)

Letter in the conversation, Achim Zeileis, has surprised us (well, me) saying the following

I’ve thought about adding a plot() method for the coeftest() function in the “lmtest” package. Essentially, it relies on a coef() and a vcov() method being available – and that a central limit theorem holds. For releasing it as a general function in the package the code is still too raw, but maybe it’s useful for someone on the list. Hence, I’ve included it below.

(I allowed myself to add some bolds in the text)

So for the convenience of all of us, I uploaded Achim’s code in a file for easy access. Here is an example of how to use it:

source("https://www.r-statistics.com/wp-content/uploads/2010/07/coefplot.r.txt")

data("Mroz", package = "car")
fm <- glm(lfp ~ ., data = Mroz, family = binomial)
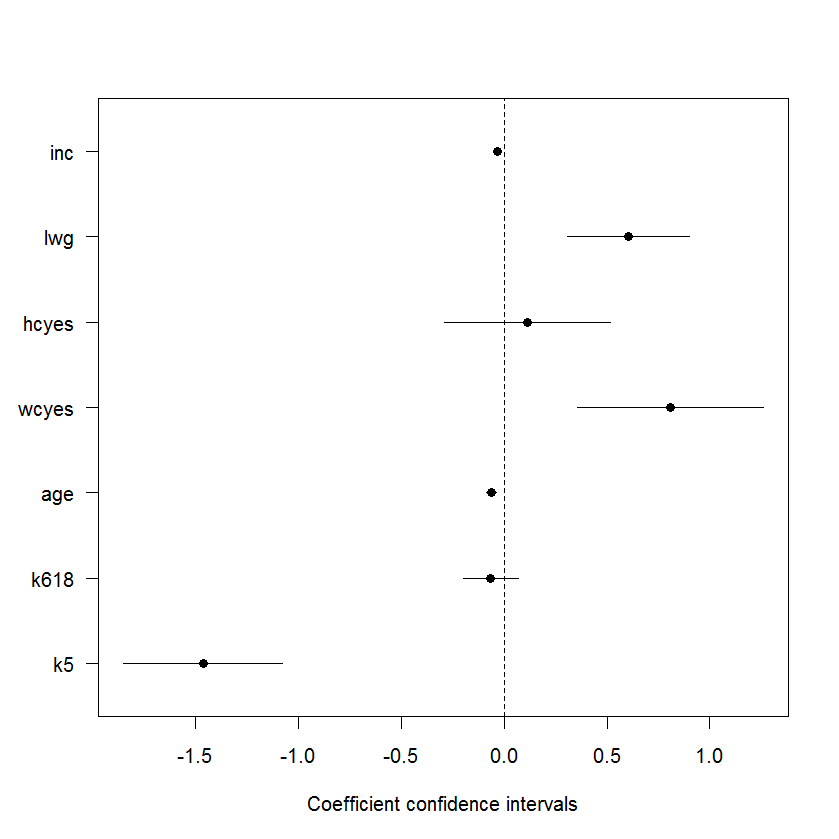
coefplot(fm, parm = -1)

Here is the resulting graph:

I hope Achim will get around to improve the function so he might think it worthy of joining his"lmtest" package. I am glad he shared his code for the rest of us to have something to work with in the meantime 🙂

* * *

Update (07.07.10):
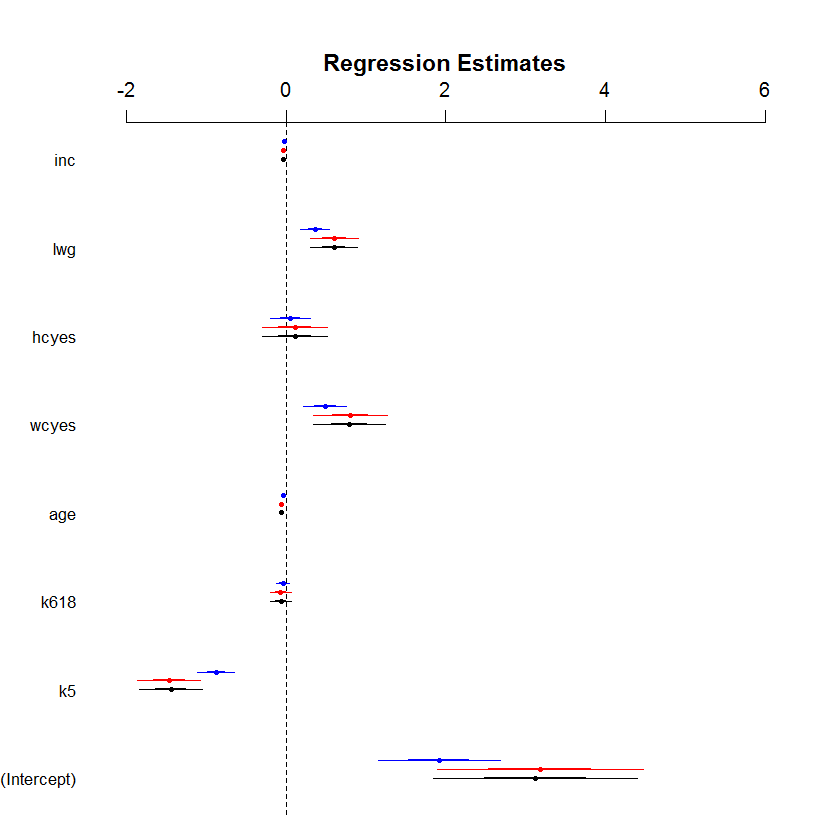
Thanks to a comment by David Atkins, I found out there is a more mature version of this function (called coefplot) inside the {arm} package. This version offers many features, one of which is the ability to easily stack several confidence intervals one on top of the other.

It works for baysglm, glm, lm, polr objects and a default method is available which takes pre-computed coefficients and associated standard errors from any suitable model.

Example:
(Notice that the Poisson model in comparison with the binomial models does not make much sense, but is enough to illustrate the use of the function)

library("arm")
data("Mroz", package = "car")
M1<-      glm(lfp ~ ., data = Mroz, family = binomial)
M2<- bayesglm(lfp ~ ., data = Mroz, family = binomial)
M3<-      glm(lfp ~ ., data = Mroz, family = binomial(probit))
coefplot(M2, xlim=c(-2, 6),            intercept=TRUE)
coefplot(M1, add=TRUE, col.pts="red",  intercept=TRUE)
coefplot(M3, add=TRUE, col.pts="blue", intercept=TRUE, offset=0.2)

(hat tip goes to Allan Engelhardt for help improving the code, and for Achim Zeileis in extending and improving the narration for the example)

Resulting plot

* * *
Lastly, another method worth mentioning is the Nomogram, implemented by Frank Harrell'a rms package.
Contest: Road Traffic Prediction for Intelligent GPS Navigation

About prize baring contests

Competition with prizes are an amazing thing. If you are not sure of that, I urge you to listened to Peter Diamandis talk about his experience with the X prize (start listening at minute 11:40):

At short – prizes can give up to 1 to 50 ratio of return on investment of the people giving funding to the prize. The money is spent only when results are achieved. And there is a lot of value in terms of public opinion and publicity. And the best of all (for the promoter of the competition) – prizes encourage people to take risks (at their own expense) in order to get results done.

All of that said, I look at prize baring competition as something worth spreading, especially in cases where the results of the winning team will be shared with the public.

About the IEEE ICDM Contest

The IEEE ICDM Contest (“Road Traffic Prediction for Intelligent GPS Navigation”), seems to be one of those cases. Due to a polite request, I am republishing here the details of this new competition, in the hope that some of my R colleagues will bring the community some pride 🙂
Continue reading “Contest: Road Traffic Prediction for Intelligent GPS Navigation”

Parallel Multicore Processing with R (on Windows)

Parallel Processing backend for R under windows – installation tips and some examples.

This post offers simple example and installation tips for “doSMP” the new Parallel Processing backend package for R under windows.
* * *

Update:
The required packages are not yet now available on CRAN, but until they will get online, you can download them from here:
REvolution foreach windows bundle
(Simply unzip the folders inside your R library folder)

* * *

Recently, REvolution blog announced the release of “doSMP”, an R package which offers support for symmetric multicore processing (SMP) on Windows.
This means you can now speed up loops in R code running iterations in parallel on a multi-core or multi-processor machine, thus offering windows users what was until recently available for only Linux/Mac users through the doMC package.

Installation

For now, doSMP is not available on CRAN, so in order to get it you will need to download the REvolution R distribution “R Community 3.2” (they will ask you to supply your e-mail, but I trust REvolution won’t do anything too bad with it…)
If you already have R installed, and want to keep using it (and not the REvolution distribution, as was the case with me), you can navigate to the library folder inside the REvolution distribution it, and copy all the folders (package folders) from there to the library folder in your own R installation.

If you are using R 2.11.0, you will also need to download (and install) the revoIPC package from here:
revoIPC package – download link (required for running doSMP on windows)
(Thanks to Tao Shi for making this available!)

Usage

Once you got the folders in place, you can then load the packages and do something like this:

require(doSMP)
workers <- startWorkers(2) # My computer has 2 cores
registerDoSMP(workers)

# create a function to run in each itteration of the loop
check <-function(n) {
	for(i in 1:1000)
	{
		sme <- matrix(rnorm(100), 10,10)
		solve(sme)
	}
}


times <- 10	# times to run the loop

# comparing the running time for each loop
system.time(x <- foreach(j=1:times ) %dopar% check(j))  #  2.56 seconds  (notice that the first run would be slower, because of R's lazy loading)
system.time(for(j in 1:times ) x <- check(j))  #  4.82 seconds

# stop workers
stopWorkers(workers)

Points to notice:

  • You will only benefit from the parallelism if the body of the loop is performing time-consuming operations. Otherwise, R serial loops will be faster
  • Notice that on the first run, the foreach loop could be slow because of R's lazy loading of functions.
  • I am using startWorkers(2) because my computer has two cores, if your computer has more (for example 4) use more.
  • Lastly - if you want more examples on usage, look at the "ParallelR Lite User's Guide", included with REvolution R Community 3.2 installation in the "doc" folder

Updates

(15.5.10) :
The new R version (2.11.0) doesn't work with doSMP, and will return you with the following error:

Loading required package: revoIPC
Error: package 'revoIPC' was built for i386-pc-intel32


So far, a solution is not found, except using REvolution R distribution, or using R 2.10
A thread on the subject was started recently to report the problem. Updates will be given in case someone would come up with better solutions.

Thanks to Tao Shi, there is now a solution to the problem. You'll need to download the revoIPC package from here:
revoIPC package - download link (required for running doSMP on windows)
Install the package on your R distribution, and follow all of the other steps detailed earlier in this post. It will now work fine on R 2.11.0


Update 2: Notice that I added, in the beginning of the post, a download link to all the packages required for running parallel foreach with R 2.11.0 on windows. (That is until they will be uploaded to CRAN)

Update 3 (04.03.2011): doSMP is now officially on CRAN!

"The next big thing", R, and Statistics in the cloud

A friend just e-mailed me about a blog post by Dr. AnnMaria De Mars titled “The Next Big Thing”.

In it Dr. De Mars wrote (I allowed myself to emphasize some parts of the text):

Contrary to what some people seem to think, R is definitely not the next big thing, either. I am always surprised when people ask me why I think that, because to my mind it is obvious. […]
for me personally and for most users, both individual and organizational, the much greater cost of software is the time it takes to install it, maintain it, learn it and document it. On that, R is an epic fail. It does NOT fit with the way the vast majority of people in the world use computers. The vast majority of people are NOT programmers. They are used to looking at things and clicking on things.

Here are my two cents on the subject:
Continue reading “"The next big thing", R, and Statistics in the cloud”

Repeated measures ANOVA with R (functions and tutorials)

Repeated measures ANOVA is a common task for the data analyst.

There are (at least) two ways of performing “repeated measures ANOVA” using R but none is really trivial, and each way has it’s own complication/pitfalls (explanation/solution to which I was usually able to find through searching in the R-help mailing list).

So for future reference, I am starting this page to document links I find to tutorials, explanations (and troubleshooting) of “repeated measure ANOVA” done with R

Functions and packages

(I suggest using the tutorials supplied bellow for how to use these functions)

  • aov {stats} – offers SS type I repeated measures anova, by a call to lm for each stratum. A short example is given in the ?aov help file
  • Anova {car} – Calculates type-II or type-III analysis-of-variance tables for model objects produced by lm, and for various other object. The ?Anova help file offers an example for how to use this for repeated measures
  • ezANOVA {ez} – This function provides easy analysis of data from factorial experiments, including purely within-Ss designs (a.k.a. “repeated measures”), purely between-Ss designs, and mixed within-and-between-Ss designs, yielding ANOVA results and assumption checks. It is a wrapper of the Anova {car} function, and is easier to use. The ez package also offers the functions ezPlot and ezStats to give plot and statistics of the ANOVA analysis. The ?ezANOVA help file gives a good demonstration for the functions use (My thanks goes to Matthew Finkbe for letting me know about this cool package)
  • friedman.test {stats} – Performs a Friedman rank sum test with unreplicated blocked data. That is, a non-parametric one-way repeated measures anova. I also wrote a wrapper function to perform and plot a post-hoc analysis on the friedman test results
  • Non parametric multi way repeated measures anova – I believe such a function could be developed based on the Proportional Odds Model, maybe using the {repolr} or the {ordinal} packages. But I still didn’t come across any function that implements these models (if you do – please let me know in the comments).
  • Repeated measures, non-parametric, multivariate analysis of variance – as far as I know, such a method is not currently available in R.  There is, however, the Analysis of similarities (ANOSIM) analysis which provides a way to test statistically whether there is a significantdifference between two or more groups of sampling units.  Is is available in the {vegan} package through the “anosim” function.  There is also a tutorial and a relevant published paper.

Good Tutorials

Troubelshooting

Unbalanced design
Unbalanced design doesn’t work when doing repeated measures ANOVA with aov, it just doesn’t. This situation occurs if there are missing values in the data or that the data is not from a fully balanced design. The way this will show up in your output is that you will see the between subject section showing withing subject variables.

A solution for this might be to use the Anova function from library car with parameter type=”III”. But before doing that, first make sure you understand the difference between SS type I, II and III. Here is a good tutorial for helping you out with that.
By the way, these links are also useful in case you want to do a simple two way ANOVA for unbalanced design

I will “later” add R-help mailing list discussions that I found helpful on the subject.

If you come across good resources, please let me know about them in the comments.

Correlation scatter-plot matrix for ordered-categorical data

When analyzing a questionnaire, one often wants to view the correlation between two or more Likert questionnaire item’s (for example: two ordered categorical vectors ranging from 1 to 5).

When dealing with several such Likert variable’s, a clear presentation of all the pairwise relation’s between our variable can be achieved by inspecting the (Spearman) correlation matrix (easily achieved in R by using the “cor.test” command on a matrix of variables).
Yet, a challenge appears once we wish to plot this correlation matrix. The challenge stems from the fact that the classic presentation for a correlation matrix is a scatter plot matrix – but scatter plots don’t (usually) work well for ordered categorical vectors since the dots on the scatter plot often overlap each other.

There are four solution for the point-overlap problem that I know of:

  1. Jitter the data a bit to give a sense of the “density” of the points
  2. Use a color spectrum to represent when a point actually represent “many points”
  3. Use different points sizes to represent when there are “many points” in the location of that point
  4. Add a LOWESS (or LOESS) line to the scatter plot – to show the trend of the data

In this post I will offer the code for the  a solution that uses solution 3-4 (and possibly 2, please read this post comments). Here is the output (click to see a larger image):

And here is the code to produce this plot:

Continue reading “Correlation scatter-plot matrix for ordered-categorical data”

Nutritional supplements efficacy score – Graphing plots of current studies results (using R)

In this post I showcase a nice bar-plot and a balloon-plot listing recommended Nutritional supplements , according to how much evidence exists for thier benefits, scroll down to see it(and click here for the data behind it)
* * * *
The gorgeous blog “Information Is Beautiful” recently publish an eye candy post showing a “balloon race” image (see a static version of the image here) illustrating how much evidence exists for the benefits of various Nutritional supplements (such as: green tea, vitamins, herbs, pills and so on) . The higher the bubble in the Y axis score (e.g: the bubble size) for the supplement the greater the evidence there is for its effectiveness (But only for the conditions listed along side the supplement).

There are two reasons this should be of interest to us:

  1. This shows a fun plot, that R currently doesn’t know how to do (at least I wasn’t able to find an implementation for it). So if anyone thinks of an easy way for making one – please let me know.
  2. The data for the graph is openly (and freely) provided to all of us on this Google Doc.

The advantage of having the data on a google doc means that we can see when the data will be updated. But more then that, it means we can easily extract the data into R and have our way with it (Thanks to David Smith’s post on the subject)

For example, I was wondering what are ALL of the top recommended Nutritional supplements, an answer that is not trivial to get from the plot that was in the original post.

In this post I will supply two plots that present the data: A barplot (that in retrospect didn’t prove to be good enough) and a balloon-plot for a table (that seems to me to be much better).

Barplot
(You can click the image to enlarge it)

The R code to produce the barplot of Nutritional supplements efficacy score (by evidence for its effectiveness on the listed condition).


# loading the data
supplements.data.0 <- read.csv("http://spreadsheets.google.com/pub?key=0Aqe2P9sYhZ2ndFRKaU1FaWVvOEJiV2NwZ0JHck12X1E&output=csv")
supplements.data <- supplements.data.0[supplements.data.0[,2] >2,] # let's only look at "good" supplements
supplements.data <- supplements.data[!is.na(supplements.data[,2]),] # and we don't want any missing data

supplement.score <- supplements.data[, 2]
ss <- order(supplement.score, decreasing  = F)	# sort our data
supplement.score <- supplement.score[ss]
supplement.name <- supplements.data[ss, 1]
supplement.benefits <- supplements.data[ss, 4]
supplement.score.col <- factor(as.character(supplement.score))
	levels(supplement.score.col) <-  c("red", "orange", "blue", "dark green")
	supplement.score.col <- as.character(supplement.score.col)

# mar: c(bottom, left, top, right) The default is c(5, 4, 4, 2) + 0.1.
par(mar = c(5,9,4,13))	# taking care of the plot margins
bar.y <- barplot(supplement.score, names.arg= supplement.name, las = 1, horiz = T, col = supplement.score.col, xlim = c(0,6.2),
				main = c("Nutritional supplements efficacy score","(by evidence for its effectiveness on the listed condition)", "(2010)"))
axis(4, labels = supplement.benefits, at = bar.y, las = 1) # Add right axis
abline(h = bar.y, col = supplement.score.col , lty = 2) # add some lines so to easily follow each bar

Also, the nice things is that if the guys at Information Is Beautiful will update there data, we could easily run the code and see the updated list of recommended supplements.

Balloon plot
So after some web surfing I came around an implementation of a balloon plot in R (Thanks to R graph gallery)
There where two problems with using the command out of the box. The first one was that the colors where non informative (easily fixed), the second one was that the X labels where overlapping one another. Since there is no "las" parameter in the function, I just opened the function up, found where this was plotted and changed it manually (a bit messy, but that's what you have to do sometimes...)

Here are the result (you can click the image for a larger image):

And here is The R code to produce the Balloon plot of Nutritional supplements efficacy score (by evidence for its effectiveness on the listed condition).
(it's just the copy of the function with a tiny bit of editing in line 146, and then using it)

Continue reading "Nutritional supplements efficacy score – Graphing plots of current studies results (using R)"

Siegel-Tukey: a Non-parametric test for equality in variability (R code)

Daniel Malter just shared on the R mailing list (link to the thread) his code for performing the Siegel-Tukey (Nonparametric) test for equality in variability.
Excited about the find, I contacted Daniel asking if I could republish his code here, and he kindly replied “yes”.
From here on I copy his note at full.

The R function can be downloaded from here
Corrections and remarks can be added in the comments bellow, or on the github code page.

* * * *
Continue reading “Siegel-Tukey: a Non-parametric test for equality in variability (R code)”

Statistics plugins for WordPress

Today I came across a post named “24 Noble WordPress Plugins To Determine The Performance of your Blog” through Weblog Tools Collection (one of my favorite places to stay updates on wordpress). The post provided a good solid list of statistics plugins for wordpress. Some of them are too old to count (pun intended), others are much more recent and relevant.

As a statistics (and WordPress) lover myself, I was inspired to extend the list of wordpress statistics plugins for the hope of benefiting the community:
Blog Metrics
This plugin is based on ideas in an excellent post by Avinash Kaushik (Whom I consider a Web analytics guru and a brilliant blogger!).

it calculates:

  • Raw Author Contribution:
    • average number of posts per month
    • average number of words per post
  • Conversation Rate:
    • average number of comments per postwithout your own comments
    • average number of words used in comments to posts

Both for all the time you’ve been blogging, and for the last month, it then adds these values in a page on your WordPress dashboard.

Blog Metrics for a single author blogBlog metrics per author

Search Meter

This plugin is a must for any blogger. Period.

If you have a Search box on your blog, Search Meter automatically records what people are searching for — and whether they are finding what they are looking for. Search Meter’s admin interface shows you what people have been searching for in the last couple of days, and in the last week or month. It also shows you which searches have been unsuccessful. If people search your blog and get no results, they’ll probably go elsewhere. With Search Meter, you’ll be able to find out what people are searching for, and give them what they want by creating new posts on those topics.  […]

Google analytics Dashboard

Google Analytics Dashboard gives you the ability to view your Google Analytics data in your WordPress dashboard. You can also alow other users to see the same dashboard information when they are logged in or embed parts of the data into posts or as part of your theme.

The biggest advantage of this plugin in my view is that it adds sparklines in the “posts -> edit” page in the admin area.

Analytics360
I don’t use this one much. But one feature it has that I find interesting is that is adds information of when you posted something with the trend line of the google analytics traffic data. It also mixes data from MailChimp’s, which I don’t use.

MailChimp’s Analytics360 plugin allows you to pull Google Analytics and MailChimp data directly into your dashboard, so you can access robust analytics tools without leaving WordPress.

Broken Link Checker
This plugin is also a must.

This plugin will monitor your blog looking for broken links and let you know if any are found.

  • Monitors links in your posts, pages, the blogroll, and custom fields (optional).
  • Detects links that don’t work and missing images.
  • Notifies you on the Dashboard if any are found.
  • Also detects redirected links.
  • Makes broken links display differently in posts (optional).
  • Link checking intervals can be configured.
  • New/modified posts are checked ASAP.
  • You view broken links, redirects, and a complete list of links used on your site, in the Tools -> Broken Links tab.
  • Searching and filtering links by URL, anchor text and so on is also possible.
  • Each link can be edited or unlinked directly via the plugin’s page, without manually editing each post.

Piwik + WP-Piwik

This plugin adds a Piwik stats site to your WordPress dashboard. It’s also able to add the Piwik tracking code to your blog.
Piwik is an open source (GPL licensed) web analytics software program. It provides you with detailed real time reports on your website visitors: the search engines and keywords they used, the language they speak, your popular pages and so on…

You can install Piwik more or less like you install WordPress, and then you are left to integrate it into your blog. The only real down side of it for me (compared to google analytics) is the advanced segmentation and pivoting. But in general it is a free, great (and growing!) Web analytics solution.

Woopra Analytics Plugin
I have been using Woopra since their release thanks to lorelle. I enjoy the ability to follow the live actions that are happening inside the blog. Although since woopra went from BETA to GOLD, I lost most interest because the total blogs I track have more traffic volume then woopra allow tracking in their free account. But small bloggers could find the service gratifying.

Woopra is the world’s most comprehensive, information rich, easy to use, real-time Web tracking and analysis application.

Features include:

  • Live Tracking and Web Statistics
  • A rich user interface and client monitoring application
  • Real-time Analytics
  • Manage Multiple Blogs and Websites
  • Deep analytic and search capabilities
  • Click-to-chat
  • Visitor and member tagging
  • Real-time notifications
  • Easy Installation and Update Notification

Final notes

If you are into web analytics, I also encourage you to give the following a try: Nuconomy,ClickTale, Crazy Egg. And of course, Google analytics. Each of them (and also Woopra) strips you and your visitors a bit more from their privacy. But that is the ultimate price we pay for the strong Web analytics solutions that exists out there.
If you got any more statistics plugins I missed, feel encouraged to share them with me in the comments 🙂

Free statistics e-books for download

This post will eventually grow to hold a wide list of books on statistics (e-books, pdf books and so on) that are available for free download.  But for now we’ll start off with just one several books:


Several of these books were discovered through a CrossValidated discussion:

  1. http://stats.stackexchange.com/questions/614/open-source-statistical-textbooks/
  2. https://stats.stackexchange.com/questions/170/free-statistical-textbooks

* * *

Know of any more e-books freely available for download? Please write to us about them in the comments.