R 3.4.3 is released (a bug-fix release)

R 3.4.3 (codename “Kite-Eating Tree”) was released last week. You can get the latest binaries version from here. (or the .tar.gz source code from here).

As mentioned by David Smith, R 3.4.3 is primarily a bug-fix release:

It fixes an issue with incorrect time zones on MacOS High Sierra, and some issues with handling Unicode characters. (Incidentally, representing international and special characters is something that R takes great care in handling properly. It’s not an easy task: a 2003 essay by Joel Spolsky describes the minefield that is character representation, and not much has changed since then.)

The full list of bug fixes and new features is provided below.

Upgrading to R 3.4.3 on Windows

If you are using Windows you can easily upgrade to the latest version of R using the installr package. Simply run the following code in Rgui:

install.packages("installr") # install 
setInternet2(TRUE) # only for R versions older than 3.3.0
installr::updateR() # updating R.
# If you wish it to go faster, run: installr::updateR(T)

Running “updateR()” will detect if there is a new R version available, and if so it will download+install it (etc.). There is also a step by step tutorial (with screenshots) on how to upgrade R on Windows, using the installr package. If you only see the option to upgrade to an older version of R, then change your mirror or try again in a few hours (it usually take around 24 hours for all CRAN mirrors to get the latest version of R).

I try to keep the installr package updated and useful, so if you have any suggestions or remarks on the package – you are invited to open an issue in the github page.

Continue reading “R 3.4.3 is released (a bug-fix release)”

heatmaply: an R package for creating interactive cluster heatmaps for online publishing

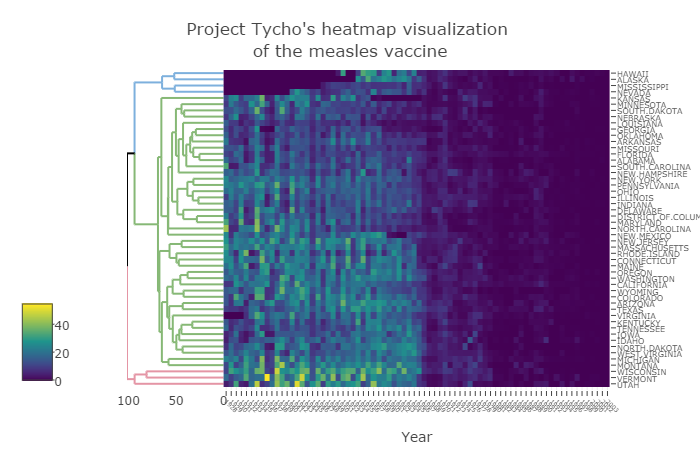
This post on the heatmaply package is based on my recent paper from the journal bioinformatics (a link to a stable DOI). The paper was published just last week, and since it is released as CC-BY, I am permitted (and delighted) to republish it here in full. My co-authors for this paper are Jonathan Sidi, Alan O’Callaghan, and Carson Sievert.

Summary: heatmaply is an R package for easily creating interactive cluster heatmaps that can be shared online as a stand-alone HTML file. Interactivity includes a tooltip display of values when hovering over cells, as well as the ability to zoom in to specific sections of the figure from the data matrix, the side dendrograms, or annotated labels.  Thanks to the synergistic relationship between heatmaply and other R packages, the user is empowered by a refined control over the statistical and visual aspects of the heatmap layout.

Availability: The heatmaply package is available under the GPL-2 Open Source license. It comes with a detailed vignette, and is freely available from: http://cran.r-project.org/package=heatmaply

Continue reading “heatmaply: an R package for creating interactive cluster heatmaps for online publishing”

R 3.4.2 is released (with several bug fixes and a few performance improvements)

R 3.4.2 (codename “Short Summer”) was released yesterday. You can get the latest binaries version from here. (or the .tar.gz source code from here).

As mentioned by David Smith, R 3.4.2 includes a performance improvement for names:

c() and unlist() are now more efficient in constructing the names(.) of their return value, thanks to a proposal by Suharto Anggono. (PR#17284)

The full list of bug fixes and new features is provided below.

Thank you Duncan Murdoch !

On a related note, following the announcement on R 3.4.2, Duncan Murdoch wrote yesterday:

I’ve just finished the Windows build of R 3.4.2.  It will make it to CRAN and its mirrors over the next few hours.

This is the last binary release that I will be producing.  I’ve been building them for about 15 years, and it’s time to retire.  Builds using different tools and scripts are available from https://mran.microsoft.com/download/.  I’ll be putting my own scripts on CRAN soon in case anyone wants to duplicate them.

Nightly builds of R-patched and R-devel will continue to run on autopilot for the time being, without maintenance.

I will also be retiring from maintenance of the Rtools collection.

I am grateful to Duncan for contributing so much of his time and expertise throughout the years. And I am confident that other R users, using the binaries for the Windows OS, share this sentiment.

Upgrading to R 3.4.2 on Windows

If you are using Windows you can easily upgrade to the latest version of R using the installr package. Simply run the following code in Rgui:

install.packages("installr") # install 
setInternet2(TRUE) # only for R versions older than 3.3.0
installr::updateR() # updating R.
# If you wish it to go faster, run: installr::updateR(T)

Running “updateR()” will detect if there is a new R version available, and if so it will download+install it (etc.). There is also a step by step tutorial (with screenshots) on how to upgrade R on Windows, using the installr package. If you only see the option to upgrade to an older version of R, then change your mirror or try again in a few hours (it usually take around 24 hours for all CRAN mirrors to get the latest version of R).

I try to keep the installr package updated and useful, so if you have any suggestions or remarks on the package – you are invited to open an issue in the github page.

Continue reading “R 3.4.2 is released (with several bug fixes and a few performance improvements)”

R 3.4.1 is released – with some Windows related bug-fixes

R 3.4.1 (codename “Single Candle”) was released several days ago. You can get the latest binaries version from here. (or the .tar.gz source code from here).

As mentioned last week by David Smith, R 3.4.1 includes several Windows related bug fixed:

including an issue sometimes encountered when attempting to install packages on Windows, and problems displaying functions including Unicode characters (like “日本語”) in the Windows GUI.


The full list of bug fixes and new features is provided below.

Upgrading to R 3.4.1 on Windows

If you are using Windows you can easily upgrade to the latest version of R using the installr package. Simply run the following code in Rgui:

install.packages("installr") # install 
setInternet2(TRUE) # only for R versions older than 3.3.0
installr::updateR() # updating R.
# If you wish it to go faster, run: installr::updateR(T)

Running “updateR()” will detect if there is a new R version available, and if so it will download+install it (etc.). There is also a step by step tutorial (with screenshots) on how to upgrade R on Windows, using the installr package. If you only see the option to upgrade to an older version of R, then change your mirror or try again in a few hours (it usually take around 24 hours for all CRAN mirrors to get the latest version of R).

I try to keep the installr package updated and useful, so if you have any suggestions or remarks on the package – you are invited to open an issue in the github page.

Continue reading “R 3.4.1 is released – with some Windows related bug-fixes”

R 3.4.0 is released – with new speed upgrades and bug-fixes

R 3.4.0 (codename “You Stupid Darkness”) was released 3 days ago. You can get the latest binaries version from here. (or the .tar.gz source code from here). The full list of bug fixes and new features is provided below.

As mentioned two months ago by David Smith, R 3.4.0 indicates several major changes aimed at improving the performance of R in various ways. These includes:

  • The JIT (‘Just In Time’) byte-code compiler is now enabled by default at its level 3. This means functions will be compiled on first or second use and top-level loops will be compiled and then run. (Thanks to Tomas Kalibera for extensive work to make this possible.) For now, the compiler will not compile code containing explicit calls to browser(): this is to support single stepping from the browser() call. JIT compilation can be disabled for the rest of the session using compiler::enableJIT(0) or by setting environment variable R_ENABLE_JIT to 0.
  • Matrix products now consistently bypass BLAS when the inputs have NaN/Inf values. Performance of the check of inputs has been improved. Performance when BLAS is used is improved for matrix/vector and vector/matrix multiplication (DGEMV is now used instead of DGEMM). One can now choose from alternative matrix product implementations via options(matprod = ). The “internal” implementation is not optimized for speed but consistent in precision with other summations in R (using long double accumulators where available). “blas” calls BLAS directly for best speed, but usually with undefined behavior for inputs with NaN/Inf.
  • Speedup in simplify2array() and hence sapply() and mapply() (for the case of names and common length #> 1), thanks to Suharto Anggono’s PR#17118.
  • Accumulating vectors in a loop is faster – Assigning to an element of a vector beyond the current length now over-allocates by a small fraction. The new vector is marked internally as growable, and the true length of the new vector is stored in the truelength field. This makes building up a vector result by assigning to the next element beyond the current length more efficient, though pre-allocating is still preferred. The implementation is subject to change and not intended to be used in packages at this time.
  • C-LEVEL FACILITIES have been extended.
  • Radix sort (which can be considered more efficient for some cases) is now chosen by method = “auto” for sort.int() for double vectors (and hence used for sort() for unclassed double vectors), excluding ‘long’ vectors. sort.int(method = “radix”) no longer rounds double vectors. The default method until R 3.2.0 was “shell”. A minimal comparison between the two shows that for very short vectors (100 values), “shell” would perform better. From a 1000 values, they are comparable, and for larger vectors – “radix” is doing 2-3 times faster (which is probably the use case for which we would care about more). More about this can be read in ?sort.int


#> 
#> set.seed(2017-04-24)
#> x  microbenchmark(shell = sort.int(x, method = "shell"), radix = sort.int(x, method = "radix"))
Unit: microseconds
  expr    min     lq     mean median     uq    max neval cld
 shell 15.775 16.606 17.80971 17.989 18.543 33.211   100  a 
 radix 32.657 34.595 35.67700 35.148 35.702 88.561   100   b
#> 
#> set.seed(2017-04-24)
#> x  microbenchmark(shell = sort.int(x, method = "shell"), radix = sort.int(x, method = "radix"))
Unit: microseconds
  expr    min     lq     mean median      uq    max neval cld
 shell 53.414 55.074 56.54395 56.182 57.0120 96.034   100   b
 radix 45.665 46.772 48.04222 47.325 48.1555 78.598   100  a 
#> 
#> set.seed(2017-04-24)
#> x  microbenchmark(shell = sort.int(x, method = "shell"), radix = sort.int(x, method = "radix"))
Unit: milliseconds
  expr      min       lq      mean    median        uq      max neval cld
 shell 93.33140 95.94478 107.75347 103.02756 115.33709 221.0800   100   b
 radix 38.18241 39.01516  46.47038  41.45722  47.49596 159.3518   100  a 
#> 
#> 

More about the changes in R case be read at the nice post by David Smith, or in the list of changes given below.


Upgrading to R 3.4.0 on Windows

If you are using Windows you can easily upgrade to the latest version of R using the installr package. Simply run the following code in Rgui:

install.packages("installr") # install 
setInternet2(TRUE) # only for R versions older than 3.3.0
installr::updateR() # updating R.
# If you wish it to go faster, run: installr::updateR(T)

Running “updateR()” will detect if there is a new R version available, and if so it will download+install it (etc.). There is also a step by step tutorial (with screenshots) on how to upgrade R on Windows, using the installr package. If you only see the option to upgrade to an older version of R, then change your mirror or try again in a few hours (it usually take around 24 hours for all CRAN mirrors to get the latest version of R).

I try to keep the installr package updated and useful, so if you have any suggestions or remarks on the package – you are invited to open an issue in the github page.

Continue reading “R 3.4.0 is released – with new speed upgrades and bug-fixes”
shinyHeatmaply – a shiny app for creating interactive cluster heatmaps

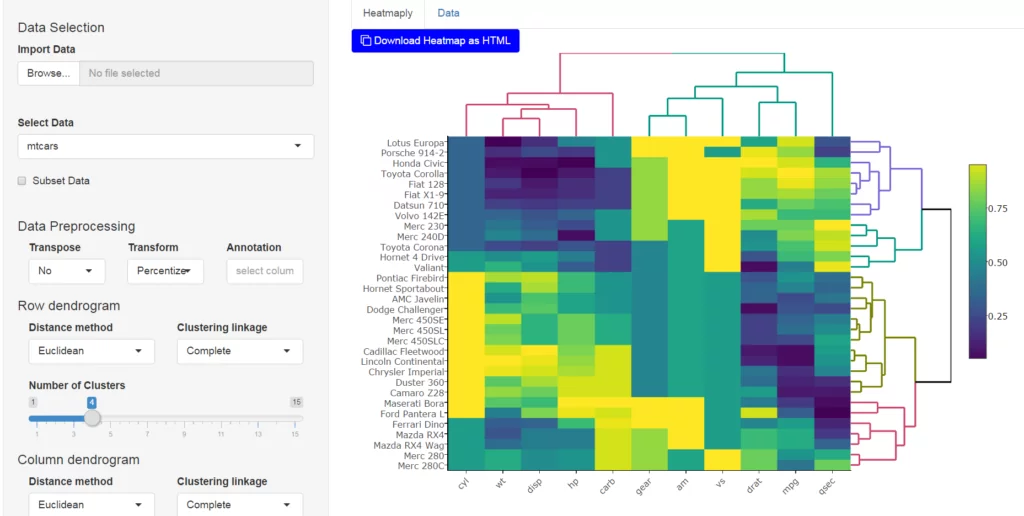
My friend Jonathan Sidi and I (Tal Galili) are pleased to announce the release of shinyHeatmaply (0.1.0): a new Shiny application (and Shiny gadget) for creating interactive cluster heatmaps. shinyHeatmaply is based on the heatmaply R package which strives to make it easy as possible to create interactive cluster heatmaps.

The app introduces a functionality that saves to disk a self contained copy of the htmlwidget as an html file with your data and specifications you set from the UI, so it can be embedded in webpages, blogposts and online web appendices for academic publications.

You can see some of shinyHeatmaply‘s capabilities in the following 40 seconds video:


Installing shinyHeatmaply

From CRAN:

install.packages('shinyHeatmaply')

From github:

devtools::install_github('yonicd/shinyHeatmaply')

Running the app/gadget

The application has an import interface as part of the application which currently supports csv, txt, tab, xls, xlsx, rd, rda. You can start the app using:

library(shiny)
library(heatmaply)
# If you didn't get shinyHeatmaply yet, you can run it through github:
# runGitHub("yonicd/shinyHeatmaply",subdir = 'inst/shinyapp')
# or just use your locally installed package:
library(shinyHeatmaply)
runApp(system.file("shinyapp", package = "shinyHeatmaply"))

The gadget is called from the R console and accepts input arguments. The object defined as the input to the shinyHeatmaply gadget is a data.frame or a list of data.frames. You can start it using the following code:

library(shinyHeatmaply)

#single data.frame
data(mtcars)
launch_heatmaply(mtcars)

#list
data(iris)
launch_heatmaply(list('Example1'=mtcars,'Example2'=iris))

You can see an example of a saved shinyHeatmaply output here. Or view the following iframe:

Continue reading “shinyHeatmaply – a shiny app for creating interactive cluster heatmaps”

R 3.3.3 is released!

R 3.3.3 (codename “Another Canoe”) was released yesterday You can get the latest binaries version from here. (or the .tar.gz source code from here). The full list of bug fixes and new features is provided below.

A quick summary by David Smith:

R 3.3.3 fixes an issue related to attempting to use download.file on sites that automatically redirect from http to https: now, R will re-attempt to download the secure link rather than failing. Other fixes include support for long vectors in the vapply function, the ability to use pmax (and pmin) on ordered factors, improved accuracy for qbeta for some extreme cases, corrected spelling for “Cincinnati” in the precip data set, and a few other minor issues.

Upgrading to R 3.3.3 on Windows

If you are using Windows you can easily upgrade to the latest version of R using the installr package. Simply run the following code in Rgui:

install.packages("installr") # install 
setInternet2(TRUE) # only for R versions older than 3.3.0
installr::updateR() # updating R.

Running “updateR()” will detect if there is a new R version available, and if so it will download+install it (etc.). There is also a step by step tutorial (with screenshots) on how to upgrade R on Windows, using the installr package. If you only see the option to upgrade to an older version of R, then change your mirror or try again in a few hours (it usually take around 24 hours for all CRAN mirrors to get the latest version of R).

I try to keep the installr package updated and useful, so if you have any suggestions or remarks on the package – you are invited to open an issue in the github page.

Continue reading “R 3.3.3 is released!”

Data Driven Cheatsheets

Guest post by Jonathan Sidi

Cheatsheets are currently built and used exclusivley as a teaching tool. We want to try and change this and produce a cheat sheet that gives a roadmap to build a known product, but also is built as a function so users can input data into it to make the cheatsheet more personalized. This gives a versalility of a consistent format that people can share with each other, but has the added value of conveying a message through data driven visual changes.

Example

ggplot2 themes

The ggplot2 theme object is an amazing object you can specify nearly any part of the plot that is not conditonal on the data. What sets the theme object apart is that its structure is consistent, but the values in it change. In addition to change a theme it is a single function that too has a consistent call. The reoccuring challenge for users is to remember all the options that can be used in the theme call (there are approximately 220 unique options to calibrate at last count) or bookmark the help page for the theme and remember how you deciphered it last time.

This becomes a problem to pass all the information of the theme to someone who does not know what the values are set in your theme and attach instructions on it to let them recreate it without needing to open any web pages.

In writing the library ggedit we tried to make it easy to edit your theme so you don’t have to know too much about ggplots to make a large number of changes at once, for a quick clip see here. We had to make it easy to track those changes for people who are not versed in R, and plot.theme() was the outcome. In short think of the theme as a lot of small images that are combined to create a singel portrait.

Continue reading “Data Driven Cheatsheets”

ggedit 0.0.2: a GUI for advanced editing of ggplot2 objects

Guest post by Jonathan Sidi, Metrum Research Group

Last week the updated version of ggedit was presented in RStudio::conf2017. First, a BIG thank you to the whole RStudio team for a great conference and being so awesome to answer the insane amount of questions I had (sorry!). For a quick intro to the package see the previous post.

To install the package:

devtools::install_github("metrumresearchgroup/ggedit",subdir="ggedit")

Highlights of the updated version.

  • verbose script handling during updating in the gagdet (see video below)
  • verbose script output for updated layers and theme to parse and evaluate in console or editor
  • colourpicker control for both single colours/fills and and palletes
  • output for scale objects eg scale*grandient,scale*grandientn and scale*manual
  • verbose script output for scales eg scale*grandient,scale*grandientn and scale*manual to parse and evaluate in console or editor
  • input plot objects can have the data in the layer object and in the base object.
    • ggplot(data=iris,aes(x=Sepal.Width,y=Sepal.Length,colour=Species))+geom_point()
    • ggplot(data=iris,aes(x=Sepal.Width,y=Sepal.Length))+geom_point(aes(colour=Species))
    • ggplot()+geom_point(data=iris,aes(x=Sepal.Width,y=Sepal.Length,colour=Species))
  • plot.theme(): S3 method for class ‘theme’
    • visualizing theme objects in single output
    • visual comparison of two themes objects in single output
    • will be expanded upon in upcoming post

Continue reading “ggedit 0.0.2: a GUI for advanced editing of ggplot2 objects”