Set Application Domain Name with Shiny Server

Guest post by AVNER KANTOR

I used the wonderful tutorial of Dean Attall to set my machine in Google cloud. After I finished to configure it successfully I wanted to redirect my domain to the Shiny application URL. This is a short description how you can do it.

Continue reading “Set Application Domain Name with Shiny Server”

Setting Rstudio server using Amazon Web Services (AWS) – a step by step (screenshots) tutorial

(this is a guest post by Liad Shekel)

Amazon Web Services (AWS) include many different computational tools, ranging from storage systems and virtual servers to databases and analytical tools. For us R-programmers, being familiar and experienced with these tools can be extremely beneficial in terms of efficiency, style, money-saving and more.

In this post we present a step-by-step screenshot tutorial that will get you to know Amazon EC2 service. We will set up an EC2 instance (Amazon virtual server), install an Rstudio server on it and use our beloved Rstudio via browser (all for free!). The slides below will also include an introduction to linux commands (basic), instructions for connecting to a remote server via ssh and more. No previous knowledge is required.

Useful links:

  1. Set up an AWS account (do not worry about the credit card details, you will not be charged for any of  our actions) – the steps are presented in the slides below.
  2. Windows users: download MobaXterm (or any other ssh client software).
    Mac users: make sure you are familiar with the terminal (cause I’m not).


Plotly Beta: Collaborative Plotting with R

(Guest post by Matt Sundquist on a lovely new service which is pro-actively supporting an API for R)

The Plotly R graphing library  allows you to create and share interactive, publication-quality plots in your browser. Plotly is also built for working together, and makes it easy to post graphs and data publicly with a URL or privately to collaborators.

In this post, we’ll demo Plotly, make three graphs, and explain sharing. As we’re quite new and still in our beta, your help, feedback, and suggestions go a long way and are appreciated. We’re especially grateful for Tal’s help and the chance to post.

Installing Plotly

Sign-up and Install (more in documentation)

From within the R console:

install.packages("devtools")
library("devtools")

Next, install plotly (a big thanks to Hadley, who suggested the GitHub route):

devtools::install_github("plotly/R-api")
# ...
# * DONE (plotly)

Then sign-up like this or at https://plot.ly/:

>library(plotly)
>response = signup (username = 'username', email= 'youremail')
…
Thanks for signing up to plotly!

Your username is: MattSundquist

Your temporary password is: pw. You use this to log into your plotly account at https://plot.ly/plot. Your API key is: “API_Key”. You use this to access your plotly account through the API.

To get started, initialize a plotly object with your username and api_key, e.g.
>>> p <- plotly(username="MattSundquist", key="API_Key")
Then, make a graph!
>>> res <- p$plotly(c(1,2,3), c(4,2,1))

And we’re up and running! You can change and access your password and key in your homepage.

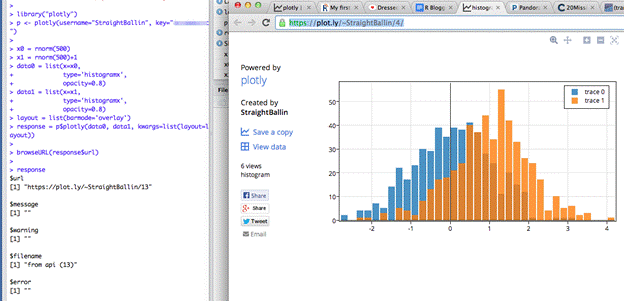
1. Overlaid Histograms:

Here is our first script.

library("plotly")
p <- plotly(username="USERNAME", key="API_Key")

x0 = rnorm(500)
x1 = rnorm(500)+1
data0 = list(x=x0,
             type='histogramx',
opacity=0.8)
data1 = list(x=x1,
             type='histogramx',
opacity=0.8)
layout = list(barmode='overlay')

response = p$plotly(data0, data1, kwargs=list(layout=layout))

browseURL(response$url)

The script makes a graph. Use the RStudio viewer or add “browseURL(response$url)” to your script to avoid copy and paste routines of your URL and open the graph directly.

image001

Continue reading "Plotly Beta: Collaborative Plotting with R"

R-bloggers: an example of how interest networks propel viral events

A guest post by Jeff Hemsley, who has co-authored with Karine Nahon a new book titled Going Viral.
————————-

In Going Viral (Polity Press, 2013) we explore the topic of virality, the process of sharing messages that results in a fast, broad spread of information. What does that have to do R, or the R-bloggers community? First and foremost, we use the R-bloggers community as an example of the role of interest networks (see description below) in driving viral events. But we also used R as our go-to tool for our research that went into the book. Even the cover art, pictured here, was created with R, using the iGraph package. Included below is an excerpt from chapter 4 that includes the section on interest networks and R-bloggers.

GoingViral

Continue reading “R-bloggers: an example of how interest networks propel viral events”

Analyzing Your Data on the AWS Cloud (with R)

Guest post by Jonathan Rosenblatt

Disclaimer:
This post is not intended to be a comprehensive review, but more of a “getting started guide”. If I did not mention an important tool or package I apologize, and invite readers to contribute in the comments.

Introduction

I have recently had the delight to participate in a “Brain Hackathon” organized as part of the OHBM2013 conference. Being supported by Amazon, the hackathon participants were provided with Amazon credit in order to promote the analysis using Amazon’s Web Services (AWS). We badly needed this computing power, as we had 14*109 p-values to compute in order to localize genetic associations in the brain leading to Figure 1.

Figure 1- Brain volumes significantly associated to genotype.
brain_image01

While imaging genetics is an interesting research topic, and the hackathon was a great idea by itself, it is the AWS I wish to present in this post. Starting with the conclusion: 

Storing your data and analyzing it on the cloud, be it AWSAzureRackspace or others, is a quantum leap in analysis capabilities. I fell in love with my new cloud powers and I strongly recommend all statisticians and data scientists get friendly with these services. I will also note that if statisticians do not embrace these new-found powers, we should not be surprised if data analysis becomes synonymous with Machine Learning and not with Statistics (if you have no idea what I am talking about, read this excellent post by Larry Wasserman).

As motivation for analysis in the cloud consider:

  1. The ability to do your analysis from any device, be it a PC, tablet or even smartphone.
  2. The ability to instantaneously augment your CPU and memory to any imaginable configuration just by clicking a menu. Then scaling down to save costs once you are done.
  3. The ability to instantaneously switch between operating systems and system configurations.
  4. The ability to launch hundreds of machines creating your own cluster, parallelizing your massive job, and then shutting it down once done.

Here is a quick FAQ before going into the setup stages.

FAQ

Q: How does R fit in?

Continue reading “Analyzing Your Data on the AWS Cloud (with R)”

100 most read R posts for 2012 (stats from R-bloggers) – big data, visualization, data manipulation, and other languages

R-bloggers.com is now three years young. The site is an (unofficial) online journal of the R statistical programming environment, written by bloggers who agreed to contribute their R articles to the site.

Last year, I posted on the top 24 R posts of 2011. In this post I wish to celebrate R-bloggers’ third birthmounth by sharing with you:

  1. Links to the top 100 most read R posts of 2012
  2. Statistics on “how well” R-bloggers did this year
  3. My wishlist for the R community for 2013 (blogging about R, guest posts, and sponsors)

1. Top 100 R posts of 2012

R-bloggers’ success is thanks to the content submitted by the over 400 R bloggers who have joined r-bloggers.  The R community currently has around 245 active R bloggers (links to the blogs are clearly visible in the right navigation bar on the R-bloggers homepage).  In the past year, these bloggers wrote around 3200 posts about R!

Here is a list of the top visited posts on the site in 2012 (you can see the number of unique visitors in parentheses, while the list is ordered by the number of total page views):

Continue reading “100 most read R posts for 2012 (stats from R-bloggers) – big data, visualization, data manipulation, and other languages”

Generation of E-Learning Exams in R for Moodle, OLAT, etc.

(Guest post by Achim Zeileis)
Development of the R package exams for automatic generation of (statistical) exams in R started in 2006 and version 1 was published in JSS by Grün and Zeileis (2009). It was based on standalone Sweave exercises, that can be combined into exams, and then rendered into different kinds of PDF output (exams, solutions, self-study materials, etc.). Now, a major revision of the package has been released that extends the capabilities and adds support for learning management systems. It is still based on the same type of
Sweave files for each exercise but can also render them into output formats like HTML (with various options for displaying mathematical content) and XML specifications for online exams in learning management systems such as Moodle or OLAT. Supplementary files such as graphics or data are
handled automatically. Here, I give a brief overview of the new capabilities. A detailed discussion is in the working paper by Zeileis, Umlauf, and Leisch (2012) that is also contained in the package as a vignette.
Continue reading “Generation of E-Learning Exams in R for Moodle, OLAT, etc.”

Comparing Shiny with gWidgetsWWW2.rapache

(A guest post by John Verzani)

A few days back the RStudio blog announced Shiny, a new product for easily creating interactive web applications (http://www.rstudio.com/shiny/). I wanted to compare this new framework to one I’ve worked on, gWidgetsWWW2.rapache – a version of the gWidgets API for use with Jeffrey Horner’s rapache module for the Apache web server (available at GitHub). The gWidgets API has a similar aim to make it easy for R users to create interactive applications.

I don’t want to worry here about deployment of apps, just the writing side. The shiny package uses websockets to transfer data back and forth from browser to server. Though this may cause issues with wider deployment, the industrious RStudio folks have a hosting program in beta for internet-wide deployment. For local deployment, no problems as far as I know – as long as you avoid older versions of internet explorer.

Now, Shiny seems well suited for applications where the user can parameterize a resulting graphic, so that was the point of comparison. Peter Dalgaard’s tcltk package ships with a classic demo tkdensity.R. I use that for inspiration below. That GUI allows the user a few selections to modify a density plot of a random sample.
Continue reading “Comparing Shiny with gWidgetsWWW2.rapache”

"The next big thing", R, and Statistics in the cloud

A friend just e-mailed me about a blog post by Dr. AnnMaria De Mars titled “The Next Big Thing”.

In it Dr. De Mars wrote (I allowed myself to emphasize some parts of the text):

Contrary to what some people seem to think, R is definitely not the next big thing, either. I am always surprised when people ask me why I think that, because to my mind it is obvious. […]
for me personally and for most users, both individual and organizational, the much greater cost of software is the time it takes to install it, maintain it, learn it and document it. On that, R is an epic fail. It does NOT fit with the way the vast majority of people in the world use computers. The vast majority of people are NOT programmers. They are used to looking at things and clicking on things.

Here are my two cents on the subject:
Continue reading “"The next big thing", R, and Statistics in the cloud”

Jeroen Ooms's ggplot2 web interface – a new version released (V0.2)

Good news.

Jeroen Ooms released a new version of his (amazing) online ggplot2 web interface:

yeroon.net/ggplot2 is a web interface for Hadley Wickham’s R package ggplot2. It is used as a tool for rapid prototyping, exploratory graphical analysis and education of statistics and R. The interface is written completely in javascript, therefore there is no need to install anything on the client side: a standard browser will do.

The new version has a lot of cool new features, like advanced data import, integration with Google docs, converting variables from numeric to factor to dates and vice versa, and a lot of new geom’s. Some of which you can watch in his new video demo of the application:

The application is on:
http://www.yeroon.net/ggplot2/

p.s: other posts about this (including videos explaining how some of this was done) can be views on the category page: R and the web