Top 100 R packages for 2013 (Jan-May)!

What are the top 100 (most downloaded) R packages in 2013? Thanks to the recent release of RStudio of their “0-cloud” CRAN log files (but without including downloads from the primary CRAN mirror or any of the 88 other CRAN mirrors), we can now answer this question (at least for the months of Jan till May)!

By relying on the nice code that Felix Schonbrodt recently wrote for tracking packages downloads, I have updated my installr R package with functions that enables the user to easily download and visualize the popularity of R packages over time. In this post I will share some nice plots and quick insights that can be made from this great data. The code for this analysis is given at the end of this post.

Top 8 most downloaded R packages – downloads over time

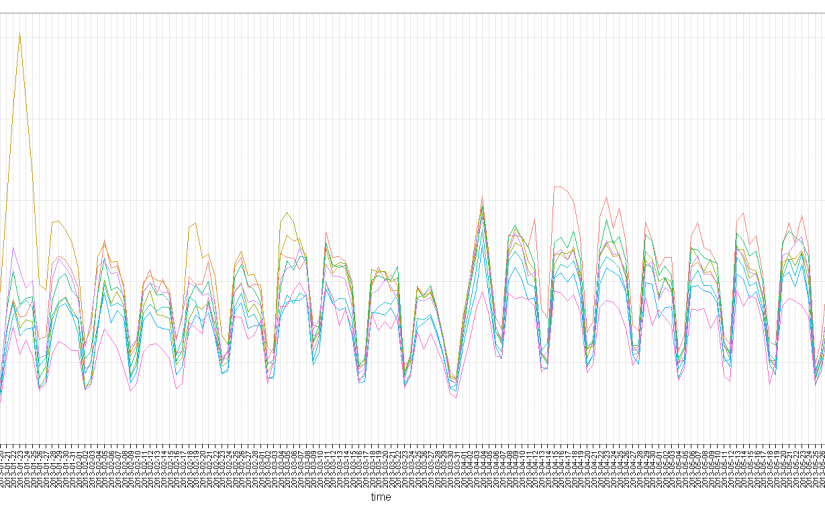
Let’s first have a look at the number of downloads per day for these 5 months, of the top 8 most downloaded packages (click the image for a larger version):

top_8_R_Packages_over_time

We can see the strong weekly seasonality of the downloads,  with Saturday and Sunday having much fewer downloads than other days. This is not surprising since we know that the countries which uses R the most have these days as rest days (see James Cheshire’s world map of R users). It is also interesting to note how some packages had exceptional peaks on some dates. For example, I wonder what happened on January 23rd 2013 that the digest package suddenly got so many downloads, or that colorspace started getting more downloads from April 15th 2013.

“Family tree” of the top 100 most downloaded R packages

We can extract from this data the top 100 most downloaded R packages. Moreover, we can create a matrix showing for each package which of our unique ids (censored IP addresses), has downloaded which package. Using this indicator matrix, we can thing of the “similarity” (or distance) between each two packages, and based on that we can create a hierarchical clustering of the packages – showing which packages “goes along” with one another.

With this analysis, you can locate package on the list which you often use, and then see which other packages are “related” to that package.  If you don’t know that package – consider having a look at it – since other R users are clearly finding the two packages to be “of use”.

Such analysis can (and should!) be extended. For example, we can imagine creating a “suggest a package” feature based on this data, utilizing the package which you use, the OS that you use, and other parameters.  But such coding is beyond the scope of this post.

Here is the “family tree” (dendrogram) of related packages:

Family_tree_of_Top_100_R_Packages

To make it easier to navigate, here is a table with links to the top 100 R packages, and their links:
Continue reading “Top 100 R packages for 2013 (Jan-May)!”

100 most read R posts for 2012 (stats from R-bloggers) – big data, visualization, data manipulation, and other languages

R-bloggers.com is now three years young. The site is an (unofficial) online journal of the R statistical programming environment, written by bloggers who agreed to contribute their R articles to the site.

Last year, I posted on the top 24 R posts of 2011. In this post I wish to celebrate R-bloggers’ third birthmounth by sharing with you:

  1. Links to the top 100 most read R posts of 2012
  2. Statistics on “how well” R-bloggers did this year
  3. My wishlist for the R community for 2013 (blogging about R, guest posts, and sponsors)

1. Top 100 R posts of 2012

R-bloggers’ success is thanks to the content submitted by the over 400 R bloggers who have joined r-bloggers.  The R community currently has around 245 active R bloggers (links to the blogs are clearly visible in the right navigation bar on the R-bloggers homepage).  In the past year, these bloggers wrote around 3200 posts about R!

Here is a list of the top visited posts on the site in 2012 (you can see the number of unique visitors in parentheses, while the list is ordered by the number of total page views):

Continue reading “100 most read R posts for 2012 (stats from R-bloggers) – big data, visualization, data manipulation, and other languages”

Calling R lovers and bloggers – to work together on "The R Programming wikibook"

This post is a call for both R community members and R-bloggers, to come and help make The R Programming wikibook be amazing.

The R Programming wikibook is not just another one of the many free books about statistics/R, it is a community project which aims to create a cross-disciplinary practical guide to the R programming language.  Here is how you can join:

Continue reading “Calling R lovers and bloggers – to work together on "The R Programming wikibook"”

Engineering Data Analysis (with R and ggplot2) – a Google Tech Talk given by Hadley Wickham

It appears that just days ago, Google Tech Talk released a new, one hour long, video of a presentation (from June 6, 2011) made by one of R’s community more influential contributors, Hadley Wickham.

This seems to be one of the better talks to send a programmer friend who is interested in getting into R.

Talk abstract

Data analysis, the process of converting data into knowledge, insight and understanding, is a critical part of statistics, but there’s surprisingly little research on it. In this talk I’ll introduce some of my recent work, including a model of data analysis. I’m a passionate advocate of programming that data analysis should be carried out using a programming language, and I’ll justify this by discussing some of the requirement of good data analysis (reproducibility, automation and communication). With these in mind, I’ll introduce you to a powerful set of tools for better understanding data: the statistical programming language R, and the ggplot2 domain specific language (DSL) for visualisation.

The video

More resources

Repeated measures ANOVA with R (functions and tutorials)

Repeated measures ANOVA is a common task for the data analyst.

There are (at least) two ways of performing “repeated measures ANOVA” using R but none is really trivial, and each way has it’s own complication/pitfalls (explanation/solution to which I was usually able to find through searching in the R-help mailing list).

So for future reference, I am starting this page to document links I find to tutorials, explanations (and troubleshooting) of “repeated measure ANOVA” done with R

Functions and packages

(I suggest using the tutorials supplied bellow for how to use these functions)

  • aov {stats} – offers SS type I repeated measures anova, by a call to lm for each stratum. A short example is given in the ?aov help file
  • Anova {car} – Calculates type-II or type-III analysis-of-variance tables for model objects produced by lm, and for various other object. The ?Anova help file offers an example for how to use this for repeated measures
  • ezANOVA {ez} – This function provides easy analysis of data from factorial experiments, including purely within-Ss designs (a.k.a. “repeated measures”), purely between-Ss designs, and mixed within-and-between-Ss designs, yielding ANOVA results and assumption checks. It is a wrapper of the Anova {car} function, and is easier to use. The ez package also offers the functions ezPlot and ezStats to give plot and statistics of the ANOVA analysis. The ?ezANOVA help file gives a good demonstration for the functions use (My thanks goes to Matthew Finkbe for letting me know about this cool package)
  • friedman.test {stats} – Performs a Friedman rank sum test with unreplicated blocked data. That is, a non-parametric one-way repeated measures anova. I also wrote a wrapper function to perform and plot a post-hoc analysis on the friedman test results
  • Non parametric multi way repeated measures anova – I believe such a function could be developed based on the Proportional Odds Model, maybe using the {repolr} or the {ordinal} packages. But I still didn’t come across any function that implements these models (if you do – please let me know in the comments).
  • Repeated measures, non-parametric, multivariate analysis of variance – as far as I know, such a method is not currently available in R.  There is, however, the Analysis of similarities (ANOSIM) analysis which provides a way to test statistically whether there is a significantdifference between two or more groups of sampling units.  Is is available in the {vegan} package through the “anosim” function.  There is also a tutorial and a relevant published paper.

Good Tutorials

Troubelshooting

Unbalanced design
Unbalanced design doesn’t work when doing repeated measures ANOVA with aov, it just doesn’t. This situation occurs if there are missing values in the data or that the data is not from a fully balanced design. The way this will show up in your output is that you will see the between subject section showing withing subject variables.

A solution for this might be to use the Anova function from library car with parameter type=”III”. But before doing that, first make sure you understand the difference between SS type I, II and III. Here is a good tutorial for helping you out with that.
By the way, these links are also useful in case you want to do a simple two way ANOVA for unbalanced design

I will “later” add R-help mailing list discussions that I found helpful on the subject.

If you come across good resources, please let me know about them in the comments.

A nice link: "Some hints for the R beginner"

Patrick Burns just posted to the mailing list the following massage:

There is now a document called “Some hints for the R beginner” whose purpose is to get people up and running with R as quickly as possible.

Direct access to it is:
http://www.burns-stat.com/pages/Tutor/hints_R_begin.html

JRR Tolkien wrote a story (sans hobbits) called ‘Leaf by Niggle’ that has always resonated with me. I offer you an imperfect, incomplete tree (but my roof is intact).

Suggestions for improvements are encouraged.

And here is the link tree for the document (for your easy reviewing of the offered content) :

Continue reading “A nice link: "Some hints for the R beginner"”