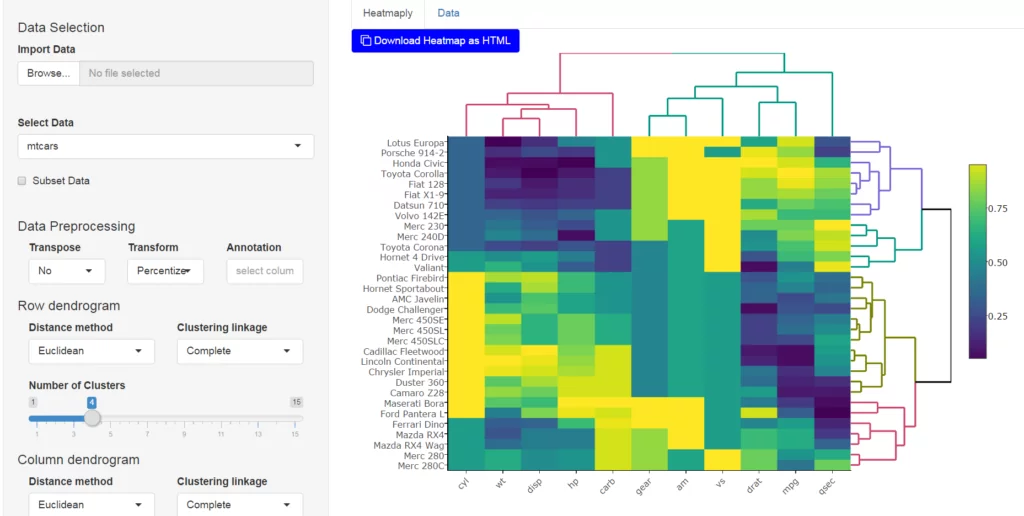
My friend Jonathan Sidi and I (Tal Galili) are pleased to announce the release of shinyHeatmaply (0.1.0): a new Shiny application (and Shiny gadget) for creating interactive cluster heatmaps. shinyHeatmaply is based on the heatmaply R package which strives to make it easy as possible to create interactive cluster heatmaps.
The app introduces a functionality that saves to disk a self contained copy of the htmlwidget as an html file with your data and specifications you set from the UI, so it can be embedded in webpages, blogposts and online web appendices for academic publications.
You can see some of shinyHeatmaply‘s capabilities in the following 40 seconds video:
Installing shinyHeatmaply
From CRAN:
install.packages('shinyHeatmaply')
From github:
devtools::install_github('yonicd/shinyHeatmaply')
Running the app/gadget
The application has an import interface as part of the application which currently supports csv, txt, tab, xls, xlsx, rd, rda. You can start the app using:
library(shiny)
library(heatmaply)
# If you didn't get shinyHeatmaply yet, you can run it through github:
# runGitHub("yonicd/shinyHeatmaply",subdir = 'inst/shinyapp')
# or just use your locally installed package:
library(shinyHeatmaply)
runApp(system.file("shinyapp", package = "shinyHeatmaply"))
The gadget is called from the R console and accepts input arguments. The object defined as the input to the shinyHeatmaply gadget is a data.frame or a list of data.frames. You can start it using the following code:
library(shinyHeatmaply)

#single data.frame
data(mtcars)
launch_heatmaply(mtcars)

#list
data(iris)
launch_heatmaply(list('Example1'=mtcars,'Example2'=iris))
You can see an example of a saved shinyHeatmaply output here. Or view the following iframe:
Continue reading “shinyHeatmaply – a shiny app for creating interactive cluster heatmaps”
