(Guest post by Matt Sundquist on a lovely new service which is pro-actively supporting an API for R)
The Plotly R graphing library allows you to create and share interactive, publication-quality plots in your browser. Plotly is also built for working together, and makes it easy to post graphs and data publicly with a URL or privately to collaborators.
In this post, we’ll demo Plotly, make three graphs, and explain sharing. As we’re quite new and still in our beta, your help, feedback, and suggestions go a long way and are appreciated. We’re especially grateful for Tal’s help and the chance to post.
Installing Plotly
Sign-up and Install (more in documentation)
From within the R console:
install.packages("devtools")
library("devtools")
Next, install plotly (a big thanks to Hadley, who suggested the GitHub route):
devtools::install_github("plotly/R-api")
# ...
# * DONE (plotly)
Then sign-up like this or at https://plot.ly/:
>library(plotly)
>response = signup (username = 'username', email= 'youremail')
…
Thanks for signing up to plotly!

Your username is: MattSundquist

Your temporary password is: pw. You use this to log into your plotly account at https://plot.ly/plot. Your API key is: “API_Key”. You use this to access your plotly account through the API.

To get started, initialize a plotly object with your username and api_key, e.g.
>>> p <- plotly(username="MattSundquist", key="API_Key")
Then, make a graph!
>>> res <- p$plotly(c(1,2,3), c(4,2,1))
And we’re up and running! You can change and access your password and key in your homepage.
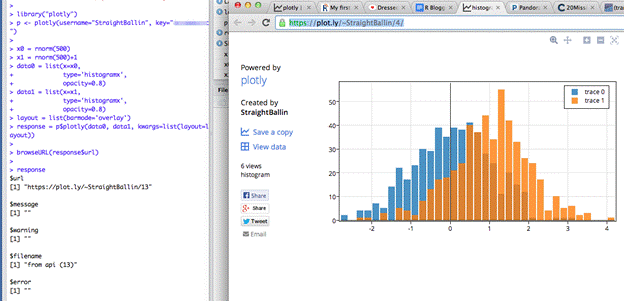
1. Overlaid Histograms:
Here is our first script.
library("plotly")
p <- plotly(username="USERNAME", key="API_Key")

x0 = rnorm(500)
x1 = rnorm(500)+1
data0 = list(x=x0,
             type='histogramx',
opacity=0.8)
data1 = list(x=x1,
             type='histogramx',
opacity=0.8)
layout = list(barmode='overlay')

response = p$plotly(data0, data1, kwargs=list(layout=layout))

browseURL(response$url)
The script makes a graph. Use the RStudio viewer or add “browseURL(response$url)” to your script to avoid copy and paste routines of your URL and open the graph directly.
Press “Save a Copy” to start styling from the GUI. So, find out “how would this look if I tweaked...,” or “what if I tweaked [element of graph I love to obsess over]?”
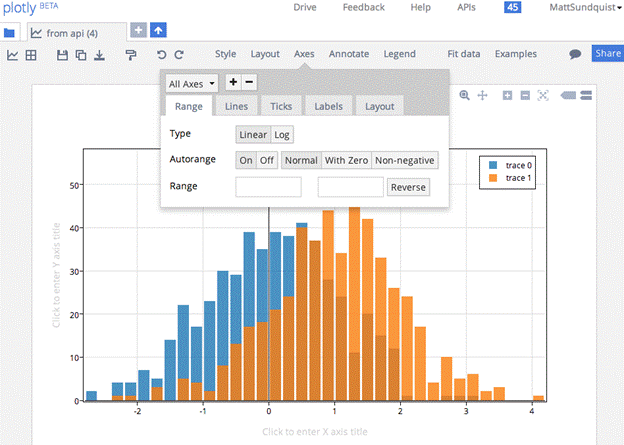
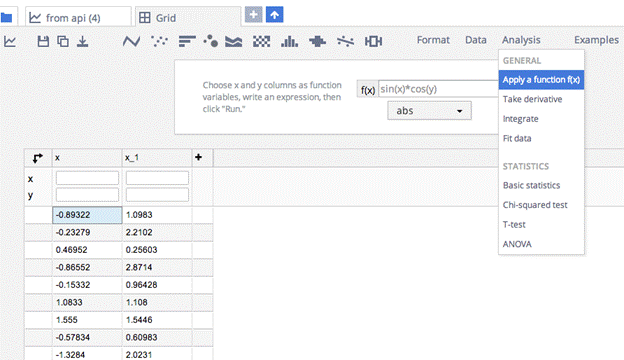
Plotly supports line charts, scatter plots, bubble charts, histograms, 2D histograms, box plots, heatmaps, and error bars. We also support log axes, date axes, multiple axes, subplots, and LaTeX. Or, analyze your data:
You can also embed your URL into this snippet to make an iframe (e.g., this Washington Post piece). You can adjust the width and height.
<iframe id="igraph" src="https://plot.ly/~MattSundquist/594/400/250/" width="400" height="250" seamless="seamless" scrolling="no"></iframe>

2. Heatmap
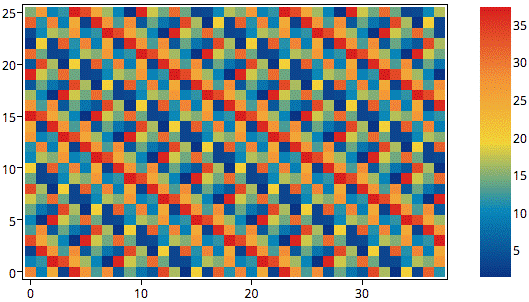
library(plotly)
p <- plotly(username='USERNAME', key='API_KEY')

zd <- matrix(rep(runif(38,0,38),26),26)

#random.sample(range(0, 41),41) for j in range(8)]
z <- tapply(z,(rep(1:nrow(z),ncol(z))),function(i)list(i))

cs <- list(
    c(0,"rgb(12,51,131)"),
    c(0.25,"rgb(10,136,186)"),
    c(0.5,"rgb(242,211,56)"),
    c(0.75,"rgb(242,143,56)"),
    c(1,"rgb(217,30,30)")
)

data <- list(
    z = zd,
    scl = cs,
    type = 'heatmap'
)

response <- p$plotly(data)

browseURL(response$url)
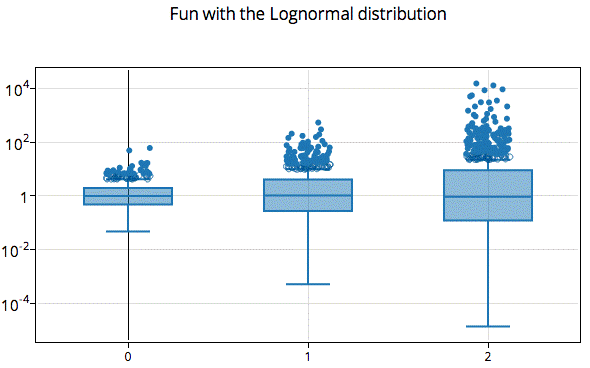
library(plotly)
p <- plotly(username='USERNAME', key='API_KEY')

x <- c(seq(0,0,length=1000),seq(1,1,length=1000),seq(2,2,length=1000))
y <- c(rlnorm(1000,0,1),rlnorm(1000,0,2),rlnorm(1000,0,3))
s <- list(
    type = 'box',
    jitter = 0.5
)
layout <- list(
    title = 'Fun with the Lognormal distribution',
    yaxis = list(
        type = 'log'
    )
)

response <- p$plotly(x,y, kwargs = list(layout = layout, style=s))

browseURL(response$url)
Collaborating and Sharing: You’re in Control
Nicola Sommacal posted about Plotly this week, which we thoroughly appreciate. He mentioned privacy, and we wanted to make sure we highlighted:
(1) You control if graphs are public or private, and who you share with (like Google Docs)
(2) Public sharing in Plotly is free (like GitHub).
To share privately, press “Share” in our GUI or share with your script. Users you share with get an email and can edit and comment on graphs. That means no more emailing data, graphs, screenshots, and spreadsheets around: you can do it all in Plotly. You can also save and apply custom themes to new data to avoid re-making the same graphs with new data. Just upload and apply your theme.
We would love to see your examples and hear your feedback. You can email our team at [email protected], or connect with us on Twitter or Facebook.
Click here to see the graphs and code for our gallery. Happy plotting!
Is it possible to replace “trace 0”, “trace 1” with the actual names of the categories in the legend?
..especially when the text is multilingual.
Yes, definitely possible. Here’s an example: https://plot.ly/api/r-project/docs/labels, and another: https://plot.ly/api/r-project/docs/line-scatter.
You’ll want to label the name in your list. Let me know if I can help with anything else. Thanks for checking out Plotly!
Nice post. You motivated me to explore and dig into this cool, new API!
If any readers running RHEL/CentOS encounter trouble installing devtools and receive an ERROR: configuration failed for package ‘RCurl’, I put up a post about it and include a fix that worked for my installation.
The post with fix are at this URL:
http://www.phillipburger.net/wordpress/2013/12/30/cannot-find-curl-config/
Thanks for the brief tutorial.
I find a problem: You say “Use the RStudio viewer”, but the RStudio viewer
can only be used for local html files and plotly creates the files on the server (which
has advantages and disadvantages). This is actually in the 4th line of the link you provide.
Agus
Thanks for checking it out! And you’re correct; I should have been more specific. You can use the RStudio viewer to serve Plotly graphs if you’re paying for an RStudio server. The free version currently does not allow for live web-content in the viewer.
We’ve talked with the RStudio team a bit, and they indicated a future plan to sandbox their viewer, in which case it would be straightforward to show live graphs from the web in an iframe in the Viewer. That’s what we do with IPython, and what we aspire to do with RStudio. You can see an IPython Notebook running R here where we directly server graphs into an iframe:
http://nbviewer.ipython.org/403910de45e282d658fa
That’s the dream for RStudio!
If you want to email me at matt at plot dot ly, I’ll keep you updated on this one. Feel free to contact their team too, as they are super helpful and friendly. And I suspect it means more for them hearing from someone besides use 🙂 .
On the topic of integration with useful R tools, we have been able to get Plotly graphs into RPubs, which you can see here and replicate if you go to the source: http://ropensci.org/blog/2014/04/17/plotly/. Also, you can put Plotly graphs into Shiny apps: https://pedrodz.shinyapps.io/shiny_example/.
I have a question: When I use plotly pakacge, it will save my data on web site? That means my data will transfer to the outside from my company?
HI Jeffery,
I assume it does. (at least the data needed for the plot itself, I assume no more – but you should search their about pages and privacy statements)
py$ggplotly(xxx)
shows error : not found . How to do that can anyone plzz help.