The question “How many people use my R package?” is a natural question that (I imagine) every R package developer asks himself at some point or another. After many years in the dark, a silver lining has now emerged thanks to the good people at RStudio. Just yesterday, a blog post by Hadley Wickham was written about the newly released CRAN log files of the RStudio cloud CRAN!
Already out, and the R blogosphere started buzzing with action: James Cheshire created a beautiful world map which highlights the countries based on how much people there use of R. Felix Schonbrodt wrote a great post on Tracking CRAN packages downloads. In the meantime, I’ve started crafting some basic functions for package developers to easily check how many users downloaded their package. These functions are now available on the installr package github page.
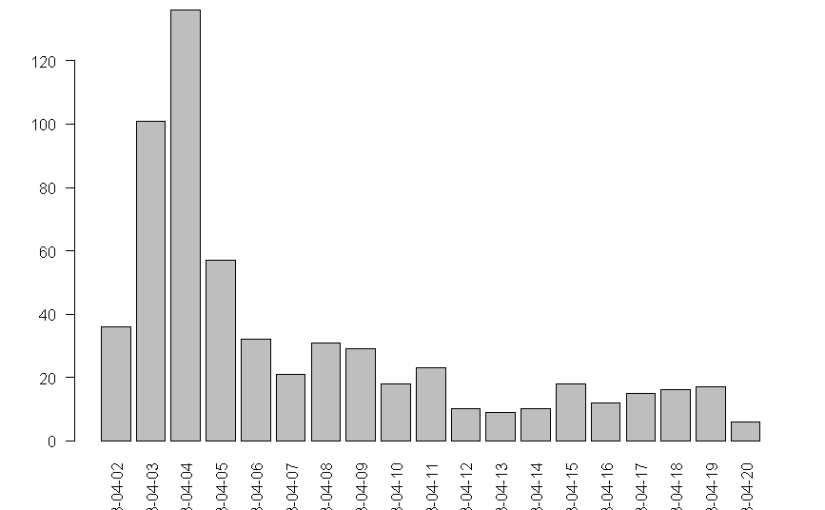
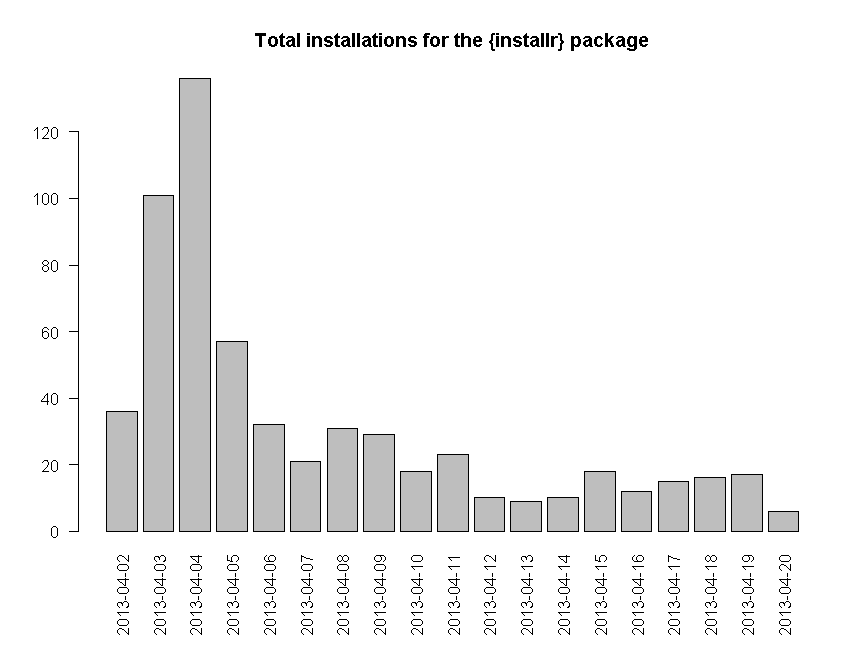
Here is the output for the number of unique ips who downloaded the installr package around the time R 3.0.0 was released (click to see a larger image):
And here is the code to allow you to make a similar plot for the package which interests you:
# if (!require('devtools')) install.packages('devtools'); require('devtools')
# make sure you have Rtools installed first! if not, then run:
#install_Rtools()
#install_github('installr', 'talgalili') # get the latest installr R package
# or run the code from here:
# https://github.com/talgalili/installr/blob/master/R/RStudio_CRAN_data.r

if(packageVersion("installr") %in% c("0.8","0.9","0.9.2")) install.packages('installr') #If you have one of the older installr versions, install the latest one....

require(installr)

# The first two functions might take a good deal of time to run (depending on the date range)
RStudio_CRAN_data_folder <- download_RStudio_CRAN_data(START = '2013-04-02', END = '2013-04-05') # around the time R 3.0.0 was released
my_RStudio_CRAN_data <- read_RStudio_CRAN_data(RStudio_CRAN_data_folder)

 # barplots: (more functions can easily be added in the future)
barplot_package_users_per_day("plyr", my_RStudio_CRAN_data)
barplot_package_users_per_day("installr", my_RStudio_CRAN_data)
If you (the reader) are interested in helping me extend (/improve) these functions, please do so - I'd be happy to accept pull requests (or comments/e-mails).
Awesome, thank you, Tal!
I’ve just checked a few packages and it was shocking to see that even a long time deprecated package like my “saves” package (that no one use IMHO) is downloaded at least 3 times a day from the RStudio servers.
I am just guessing how this could happen 🙂 But probably there are bunch of servers all around the world installing all packages from CRAN from time to time and are using RStudio/CloudFront’s infrastructure.
Anyway, the package is complaining on Linux: “It appears that you are NOT running R on the Windows OS – hence it is not clear if the package has any useful functions to offer you at this point (I’m sorry…).” that should be removed after adding these nice new features, right? 🙂
Hi Gergely,
I’m happy you like the post 🙂
I have another one planned for soon.
Regarding the package massage – thank you for the pointer, I will remove the that massage now.
With regards,
Tal
Thanks for the code, Tal, very handy! I just used it to check how many people download the Revolution Analytics packages (http://blog.revolutionanalytics.com/2013/06/a-list-of-r-packages-by-popularity.html ). Just a note for anyone using the code, be sure to install and require the “data.table” package before running the script. On my Mac R 3.0.1 kept crashing until I did that.
Hi David,
Thank you for the followup post, and your kind words. I’m happy you found this code useful.
Two points:
1) Consider updating your plot to use the function:
lineplot_package_downloads
Instead of the function from this post:
barplot_package_users_per_day
Since the first function is a more updated (allows the comparison of several packages on the same graph), better looking, visualization (code based on the coding of Felix Schonbrodt).
2) I went through the functions and noticed I’ve used require2(data.table) wherever I’ve used functions from that package. If you could tell me which function crashed your system, I’d be happy to know (since I don’t use Mac).
With regards,
Tal
Great code, Tal. This tracks the downloads from RStudio’s CRAN mirror, correct? So this would be a subset of the total downloads if people are still using the old mirrors, or am I missing something? Thanks.
Hello Grant,
Indeed – this is only a subset of all CRAN downloads (as mentioned in the first paragraph : ” CRAN log files of the RStudio cloud CRAN”).
Cheers,
Tal
Thanks so much for this great work! The “read_RStudio_CRAN_data” saves on the memory!
I think it will be nice if the start date and end date can be chosen for the read function, just like the download function. My log folder stores data spans 2 years, and I don’t want to read all of them if I want to see something of a package.
I have launched a Shiny application for visualizing R package download statistics with geographical locations as well, try it out at:
https://craigwang.shinyapps.io/rPackageStats/