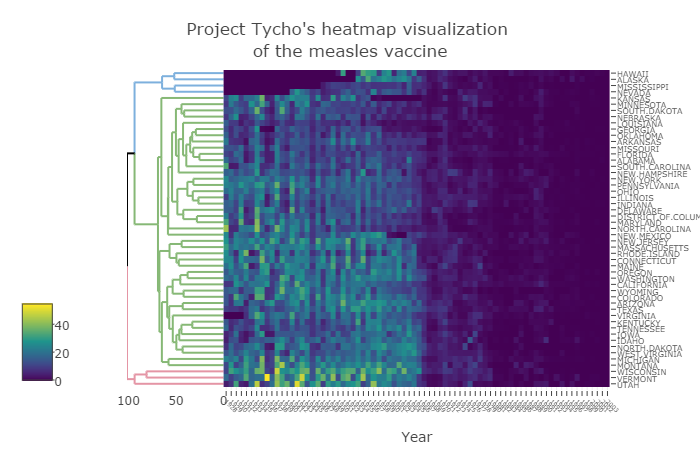
This post on the heatmaply package is based on my recent paper from the journal bioinformatics (a link to a stable DOI). The paper was published just last week, and since it is released as CC-BY, I am permitted (and delighted) to republish it here in full. My co-authors for this paper are Jonathan Sidi, Alan O’Callaghan, and Carson Sievert.
Summary: heatmaply is an R package for easily creating interactive cluster heatmaps that can be shared online as a stand-alone HTML file. Interactivity includes a tooltip display of values when hovering over cells, as well as the ability to zoom in to specific sections of the figure from the data matrix, the side dendrograms, or annotated labels. Thanks to the synergistic relationship between heatmaply and other R packages, the user is empowered by a refined control over the statistical and visual aspects of the heatmap layout.
Availability: The heatmaply package is available under the GPL-2 Open Source license. It comes with a detailed vignette, and is freely available from: http://cran.r-project.org/package=heatmaply
