Guest post by Marek Hlavac
Since its first introduction on this blog, stargazer, a package for turning R statistical output into beautiful LaTeX and ASCII text tables, has made a great deal of progress. Compared to available alternatives (such as apsrtable or texreg), the latest version (4.0) of stargazer supports the broadest range of model objects. In particular, it can create side-by-side regression tables from statistical model objects created by packages AER, betareg, dynlm, eha, ergm, gee, gmm, lme4, MASS, mgcv, nlme, nnet, ordinal, plm, pscl, quantreg, relevent, rms, robustbase, spdep, stats, survey, survival and Zelig. You can install stargazer from CRAN in the usual way:
install.packages(“stargazer”)
New Features: Text Output and Confidence Intervals
In this blog post, I would like to draw attention to two new features of stargazer that make the package even more useful:
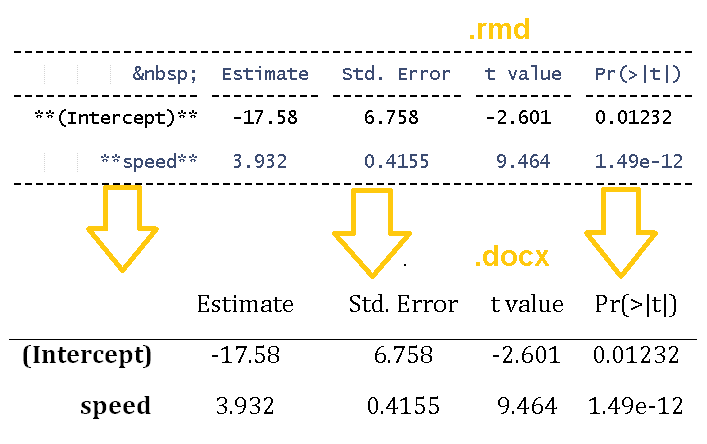
- stargazer can now produce ASCII text output, in addition to LaTeX code. As a result, users can now create beautiful tables that can easily be inserted into Microsoft Word documents, published on websites, or sent via e-mail. Sharing your regression results has never been easier. Users can also use this feature to preview their LaTeX tables before they use the stargazer-generated code in their .tex documents.
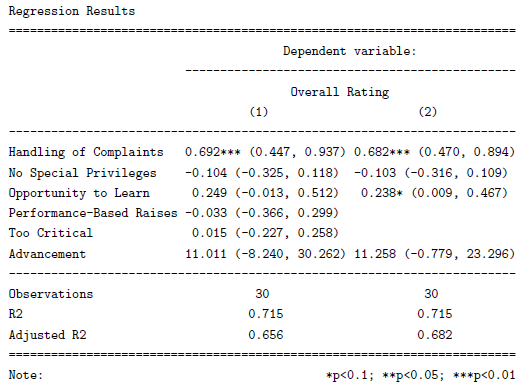
- In addition to standard errors, stargazer can now report confidence intervals at user-specified confidence levels (with a default of 95 percent). This possibility might be especially appealing to researchers in public health and biostatistics, as the reporting of confidence intervals is very common in these disciplines.
In the reproducible example presented below, I demonstrate these two new features in action.
Reproducible Example
I begin by creating model objects for two Ordinary Least Squares (OLS) models (using the lm() command) and a probit model (using glm() ). Note that I use data from attitude, one of the standard data frames that should be provided with your installation of R.
## 2 OLS models

linear.1 <- lm(rating ~ complaints + privileges + learning + raises + critical, data=attitude)
linear.2 <- lm(rating ~ complaints + privileges + learning, data=attitude)

## create an indicator dependent variable, and run a probit model

attitude$high.rating <- (attitude$rating > 70)
probit.model <- glm(high.rating ~ learning + critical + advance, data=attitude, family = binomial(link = "probit"))
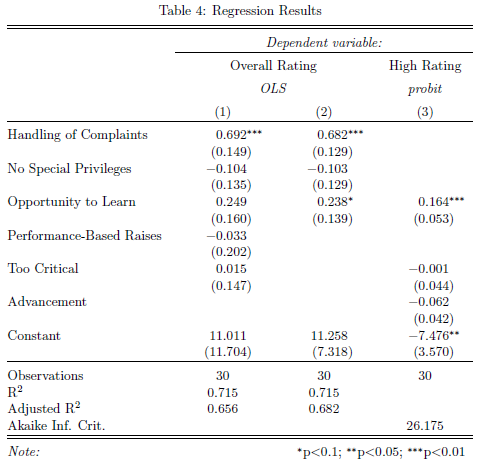
I then use stargazer to create a ‘traditional’ LaTeX table with standard errors. With the sole exception of the argument no.space – which I use to save space by removing all empty lines in the table – both the command call and the resulting table should look familiar from earlier versions of the package:
stargazer(linear.1, linear.2, probit.model, title="Regression Results", align=TRUE, dep.var.labels=c("Overall Rating","High Rating"), covariate.labels=c("Handling of Complaints","No Special Privileges", "Opportunity to Learn","Performance-Based Raises","Too Critical","Advancement"), omit.stat=c("LL","ser","f"), no.space=TRUE)
Continue reading "Tailor Your Tables with stargazer: New Features for LaTeX and Text Output"