
When using the dendextend package in your work, please cite it using:
Tal Galili (2015). dendextend: an R package for visualizing, adjusting, and comparing trees of hierarchical clustering. Bioinformatics. doi:10.1093/bioinformatics/btv428
My R package dendextend (version 1.0.1) is now on CRAN!
The dendextend package Offers a set of functions for extending dendrogram objects in R, letting you visualize and compare trees of hierarchical clusterings. With it you can (1) Adjust a tree’s graphical parameters – the color, size, type, etc of its branches, nodes and labels. (2) Visually and statistically compare different dendrograms to one another.
The previous release of dendextend (0.18.3) was half a year ago, and this version includes many new features and functions.
To help you discover how dendextend can solve your dendrogram/hierarchical-clustering issues, you may consult one of the following vignettes:
- Hierarchical cluster analysis on famous data-sets – probably the most fun to go through
- Frequently asked questions – if you are look for a quick solution on how to color your labels or branches
- Introduction to dendextend – offer details on the various functions of the package
Here is an example figure from the first vignette (analyzing the Iris dataset)

This week, at useR!2015, I will give a talk on the package. This will offer a quick example, and a step-by-step example of some of the most basic/useful functions of the package. Here are the slides:
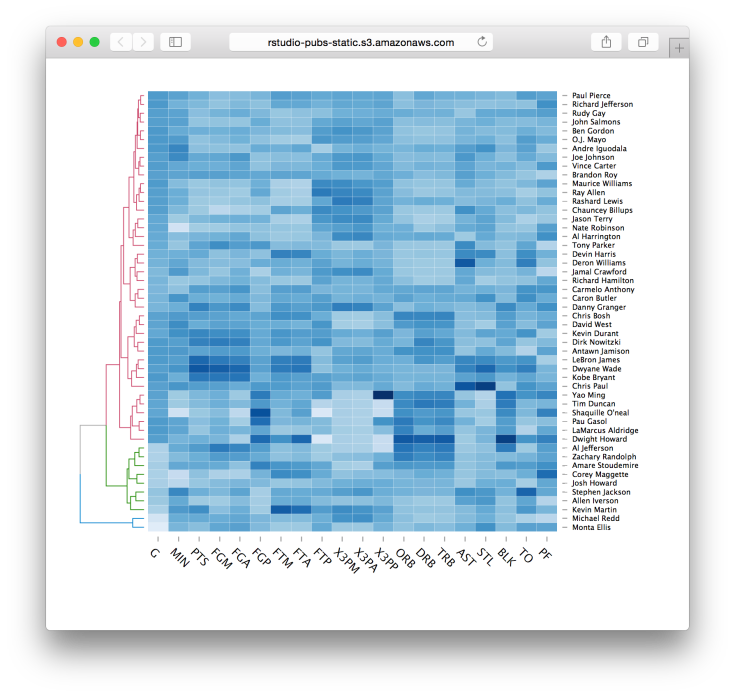
Lastly, I would like to mention the new d3heatmap package for interactive heat maps. This package is by Joe Cheng from Rstudio, and integrates well with dendrograms in general and dendextend in particular (thanks to some lovely github-commit-discussion between Joe and I). You are invited to see lively examples of the package in the post at the RStudio blog. Here is just one quick example:
d3heatmap(nba_players, colors = “Blues”, scale = “col”, dendrogram = “row”, k_row = 3)
One thought on “dendextend version 1.0.1 + useR!2015 presentation”